-
“You are not as bright as you think you are. The human brain is not built to trade stocks.” – Never mind that the human brain is also not built to drive a car, play tennis or ride a bicycle. Those are all skills that could be learned.
-
“This stock is already down 50% and it is a solid business. There is no way it can go below this level. If it does, the market is broken.” – just before the same stock drops another 30% and you panic and sell. If you don’t know why you are in stock, you won’t know when to exit, which means you will only sell when the price action scares you. Never say never and always have an exit plan.
-
“There is no way this piece of crap stock could go any higher. It has already tripled in the past year” – just before it doubles again and squeeze all short-sellers.
-
“This highly successful hedge fund billionaire is super-bearish. It is time to go 200% long and show him who’s smarter. “ – pick carefully your contrarian indicators. Some popular hedge fund managers are rich for a reason. They will not be right every time, no one is, but odds are that they know what they are doing.
-
“Despite recent evidence of the opposite, Oprah’s, Hillary’s and Icahn’s tweets don’t move markets. They are an utter waste of time, garbage signals that mean nothing, but hey look at Fibonacci extensions of the moon cycle. I can’t believe more people are not paying attention to them.” – Technical and sentiment indicators work when enough people believe and act on them. None of them have 100% success rate. The success rate of all varies substantially depending on the market cycle.
-
“Look, stock picking is too hard. Read my 1000 posts on why you are a terrible stock picker and why you should let me invest your money in a well-diversified equity index for 1% annual fee.”
-
“This company missed estimates”. – Really!? Imagine if I try to guess the exact score of Superbowl and if I don’t end up being right to blame the teams that they missed my guess.
-
“All VCs are greedy pigs because they keep great companies private for too long and don’t leave any profits for public investors.” – Never mind that many of those VCs took huge risks and have dedicated staff that actually helped those companies to become great. Never mind that probably 6 out of 10 of their investments will end up being zeros or that it it’ll take 7 to 10 years of waiting to see a payback.
The Best Performing Stock for the Past 34 Years Will Surprise You
For most people, their house is their biggest investment. Some have done a lot better than others depending on the price they paid and the region they chose to live in. What very few realize is that investing in home improvement stores would have been a lot more lucrative. In fact, the best performing stock for the past 34 years is a home improvement store.
Today, Home Depot closed at new all-time highs near $126 per share. $5000 invested in its stock on its IPO day in 1981 is worth about $25 Million today. Very few stocks have managed to average 28% annual returns over the course of so many years.
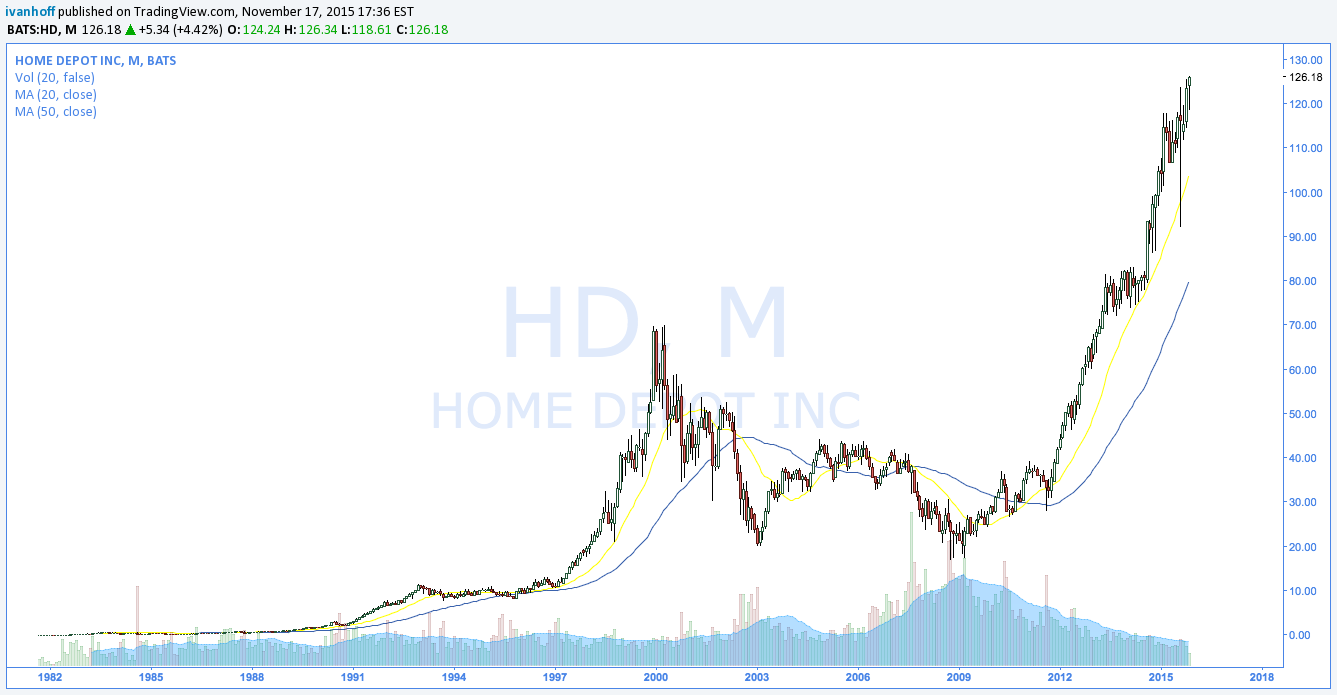
Of course, I write this with the benefit of hindsight. Finding stocks with great potential is a lot easier than holding them through the inevitable drawdowns they go through. For example, Home Depot had a 71% pullback during the bear market of early 2000s. Then, it had another 50% correction in 2007-2008. It takes a lot of conviction to hold a stock through such big setbacks. I would venture to say that the total number of individuals who bought Home Depot on its IPO day and are still holding it, is probably very close to zero.
Don’t forget that for each Home Depot that recovers from a 70% drawdown, there are 20 other story stocks that either never come back to new highs or they take decades to do so. A simple trend following system that would sell Home Depot every time it closes below its 20-month moving average and buys it back when it makes new 52-week highs would have achieved three results:
- Catch all of the upside.
- Eliminate most of the scary corrections and limit drawdowns.
- Allow to invest your capital in other stocks during periods when HD was not trending up.
Tales from A New Leading Indicator
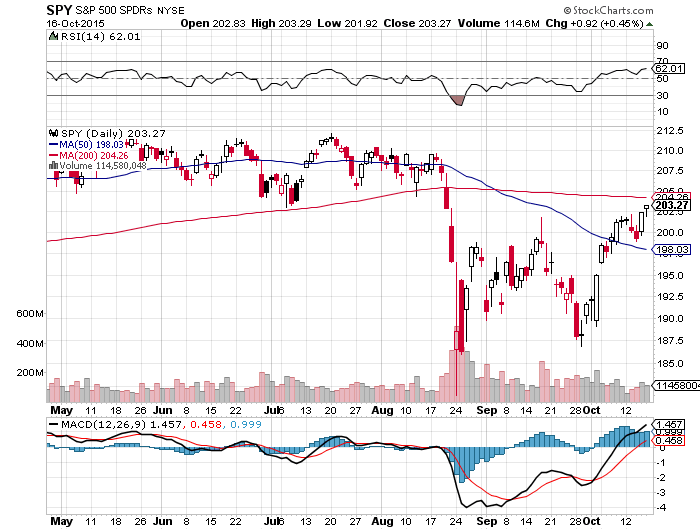
Major U.S. equity indexes are back to clear technical resistance. As a result, tail risk is near all-time highs. People are frantically pointing out to a record levels of put buying in the midst of a rise in the S & P 500. If everyone expects the possibility of a near-term correction and all are hedging against it, what are the odds that it will happen? Usually, very slim. The market rarely does what the majority of people expect.
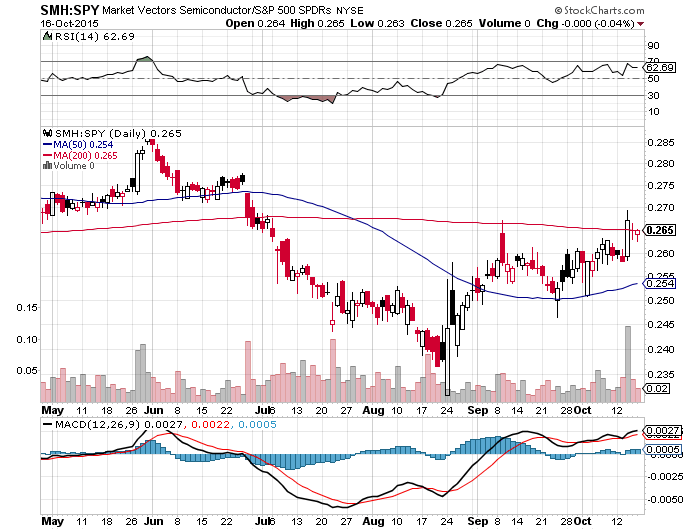
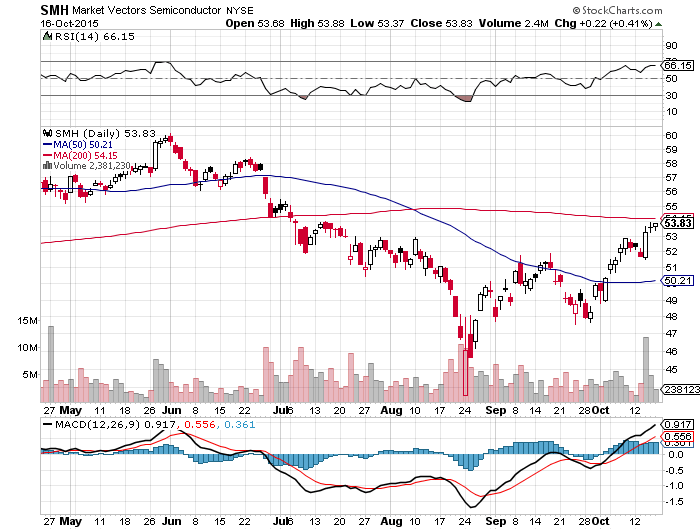
In the mean-time, semiconductors ($SMH) continue to outperform and are back against their declining 200-day moving average. Some say that they are the new Dr. Copper – the real leading indicator in markets. Remember how semis were among the first leading sectors to break down in late June? After that, they kept declining below their 50dma and foreshadowed weakness in the general market several weeks in advance. Now, all of a sudden semis are starting to outperform. Maybe, this time they are foreshadowing a market recovery? They need to clear their 200dma first, of course.
The chart below shows the ratio of Semis to S & P 500 – a great way to spot relative strength or weakness.
For more analysis and stock picks, check my premium subscription.