Long Commodities, Short Restaurants?

The first investment theme of 2012 might be already taking shape and it looks like it is the good, old reflation trade. I have noticed the relative strength in numerous energy names over the past two weeks. According to Joe Kunkle, today this action is confirmed in the options pits:

OptionsHawk: 1st Trading Day 2012 and Theme Developing in Options Action is Long Commodity, Short those impacted by input costs (apparel, restaurants) $$  Jan. 3 at 2:19 PM

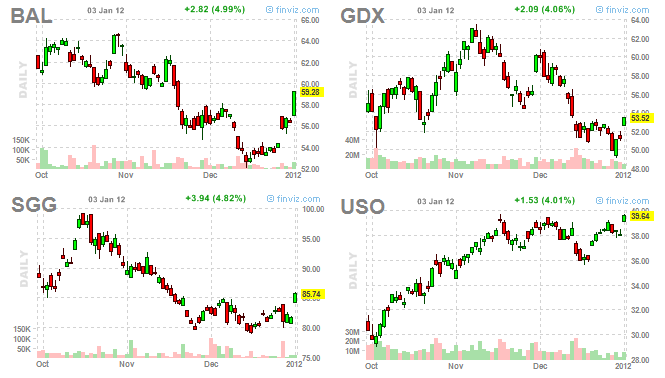
Crude oil is threatening to break out to new 6 month high, while the beaten up in 2011 cotton and sugar are showing some signs of life. Gold miners continue to recover.

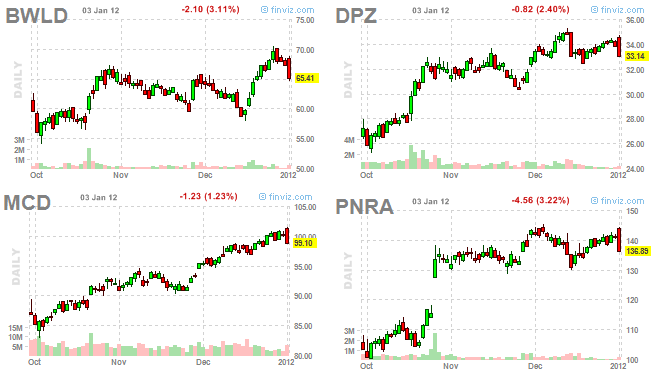
Meanwhile, we witnessed major reversal in inflation sensitive names in the restaurant industry: $BWLD, $MCD, $PNRA, $DPZ. One day does not make a trend, but it is certainly an interesting development to keep an eye on.

The reflation trade has been on and off consistently in each of the past 10 years. 2011 also had a period between February and April, when apparel and restaurant stocks suffered. The expectations for lower margins due to increasing input costs were short-lived and those stocks outperformed in the deflation labeled second part of the year.

The market tend to change its mind often and quickly, but occasionally there are periods of a few weeks to a few months, when it could stick to one theme and often over-discount it. Let’s see if reflation is among the first investment themes to take shape in 2012.
Mixing Value and Momentum

The real money in the stock market is made at the two extremes – value and momentum. The unquestionable success of those two approaches has had many capital alchemists pondering if there is something in the middle that could consistently outperform by a wide margin at the expense of lower drawdown. This quest for perfection has given birth to concepts like “Growth at Reasonable Value” and the introduction of P/S to many Momentum approaches.

Earlier this week, Josh Brown wrote a post, featuring James O’Shaughnessy and what he calls the best performing market approach for the past 50 years. This approach combines value and momentum. O’Shaughnessy ranks all stocks based on 4-5 major value criteria (P/S, P/B, P/E…) and creates a cumulative value score for each stock. Then he takes 10% of the stocks with the highest value score and picks the 25 of them with the highest trailing 6 month momentum.

A prudent question here would be, how come this approach has not been arbitraged over time. Usually when a method is insanely successful, it attracts attention and capital, which diminishes its success. If everyone knows that stocks with low P/S outperform, everyone will buy such stocks and as a result this advantage should evaporate over time. This is not the case when momentum is involved. Any market approach that integrates some form of momentum in its ranking, cannot be arbitraged. Relative strength approaches involve buying stocks with the highest performance over certain period of time (for example 3mo, 6mo, 12 mo or a combination of those). The best performing stocks attract the most capital, which makes those stocks even better performing. The whole process continues to feed on itself until the trend is violated due to profit taking.

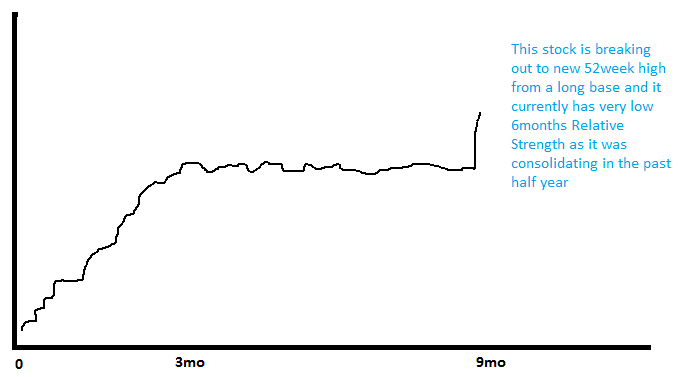
There is one more important point that I want to make regarding momentum approaches. Relative strength is based on performance, which means that stocks that went up 200% in the past 6mo will be ranked higher than stocks that went up 20%. Such an approach could do a disservice to the market alchemist as a stock that is just breaking out from a multi-year or 6 month range will have very low 6 mo performance and therefore low RS score. Essentially, blindly using RS to rank will lead to missing stocks with high probability of outperforming.


There is no one perfect momentum approach that will let you capture all big winners. A RS approach will help you capture the meatiest part of a trend. You will be able to catch stocks that go up 300% a year, when they are up only 100% (for example, you will notice a stock that is going from $20 to $80 when it is trading at $40). The new high approach will help you spot stocks as they are breaking out to uncharted territory from long bases.

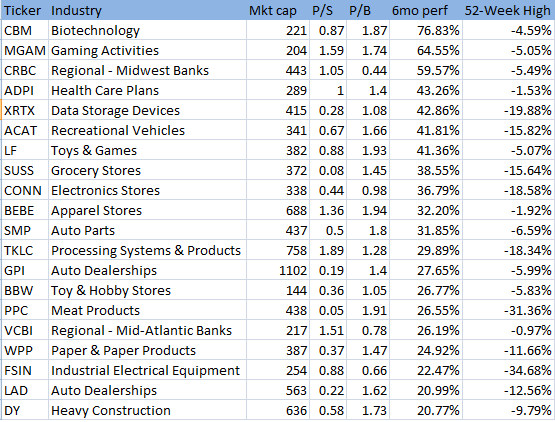
Going back to mixing value and momentum, I ran a quick simplified screen, applying a  minimum criteria for P/S<2 and P/B<2 and ranked the resulting universe of stocks based on 6mo RS:

Is Shanghai Composite the Most Overlooked Leading Technical Indicator?

There is a 13 hours time difference between Shanghai and NYC. The Chinese wake up when New York goes to bed. You could say that the Chinese live in the future in some way. What I am more interested in is the price action of the Shanghai Composite, which has been named the ultimate leading indicator by not one or two prominent investors.

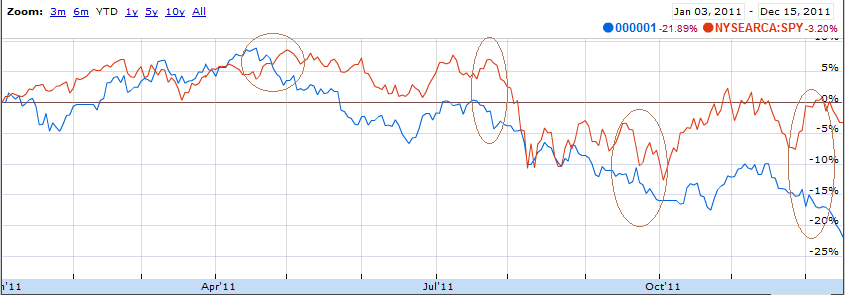
We all know that Shanghai Composite reached a major lower high and lower low in January 2008, months before the U.S. markets had their worst performance in decades. Then in the end of 2008, Shanghai Composite bottomed several months before the U.S. stock market did. This relation stays strong, even today. Every time there has been a major divergence between $SPX and Shanghai Composite this year, investors who stuck with the Chinese index were on the winning side. Shanghai has been leading at major turning points.

Let’s take a look at some of the clues this year:

– In April, the Shanghai Composite makes lower high and lower low about a week before $SPY basically tops for the year;

– In the end of July, $SPY attacks the high for the year and multiple stocks are breaking out to new all-time highs. Meanwhile, Shanghai Composite reverses and makes a lower low. Two week later, $SPY is down 20%;

– While $SPY was trading in range between mid August and September, the Shanghai Composite broke down to new YTD low. A few weeks later, $SPY retested and broke below its August low, shedding 10% in 10 trading days;

– And the most recent example: $SPY rallies 8% in a week, reaching its 200dma while the Shanghai Composite makes new 2 year low. Over the past 3 days, $SPY dropped 3.5%.

Personally I have no reasonable explanation why this has been the case. Yes, China is the second largest economy in the world and accounts for almost a quarter of the world growth. Yes, China is a major buyer of commodities, manufacturing center and export monster, but why Shanghai has been leading so often at major turning points is beyond my comprehension at this point.

It is easier to find reasonable explanations to odd events after the fact and make them look obvious in hindsight, but there is a difference between correlation and causation. I’ve always kept an eye on Shanghai Composite, but I never considered it a serious leading indicator. I will pay more attention to it from here on, fully realizing that when everyone starts to pay attention to one indicator, it miraculously stops working.