Bull markets climb a wall of worry. Financial pundits’ favorite sport is top-calling. Over the past year, a lot of digital ink has been spilled on the so-called negative divergences. Many have pointed out that the Nasdaq Composite’s new multi-year high is not sustainable, because of the rapidly decreasing number of stocks, making new 52-week highs. This is what all technical books say. Maybe, at some point, this divergence will matter. In the meantime, it won’t hurt if you look at market breadth from a different perspective. Not always, but more often than not, extreme breadth leads to mean-reversion.
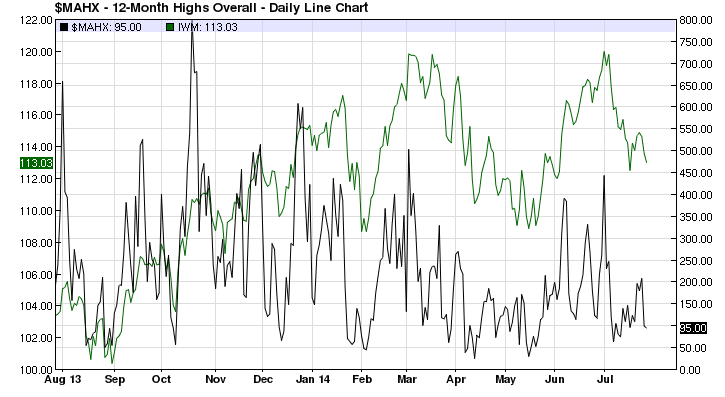
Take a look at the chart above, which plots Russell 2000 (in green, small cap index) against the number of total 52-week highs (in black). Any time in the past year, when the black line dropped below 50, there was a stock rally afterwards. Almost any time the black line went above 500, there was a pullback in small caps.
Granted, we should not judge the reliability of one indicator based on just one year of data. Any indicator that works great in a bull market might be totally useless in a bear market.
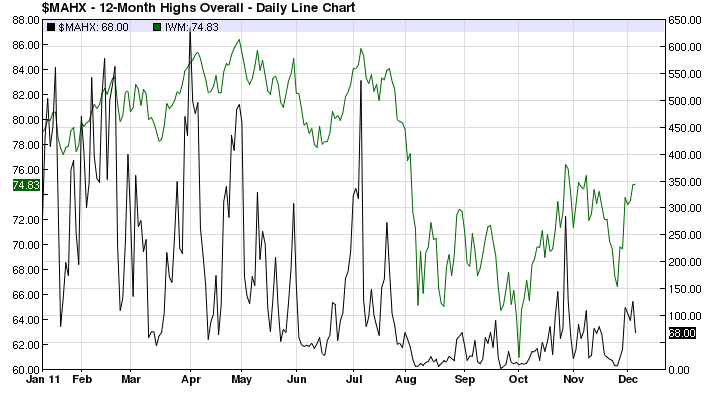
The last big market correction was in 2011, when inside of three months Russell 2000 lost 30%. The number of 52-week highs indicator was irrelevant market timing tool then.
From my perspective, the most practical indicator of market health is the number of great risk/reward long setups and how they act after they break out. Lately, the most appealing setups have been concentrated in emerging markets (mainly China) and large-cap U.S. stocks. It is a market of stocks environment, where there are plenty of opportunities for both bulls and bears.

