About GE and the 52-week Low Rule In A Bull Market

Charts in this post are powered by MarketSmith.

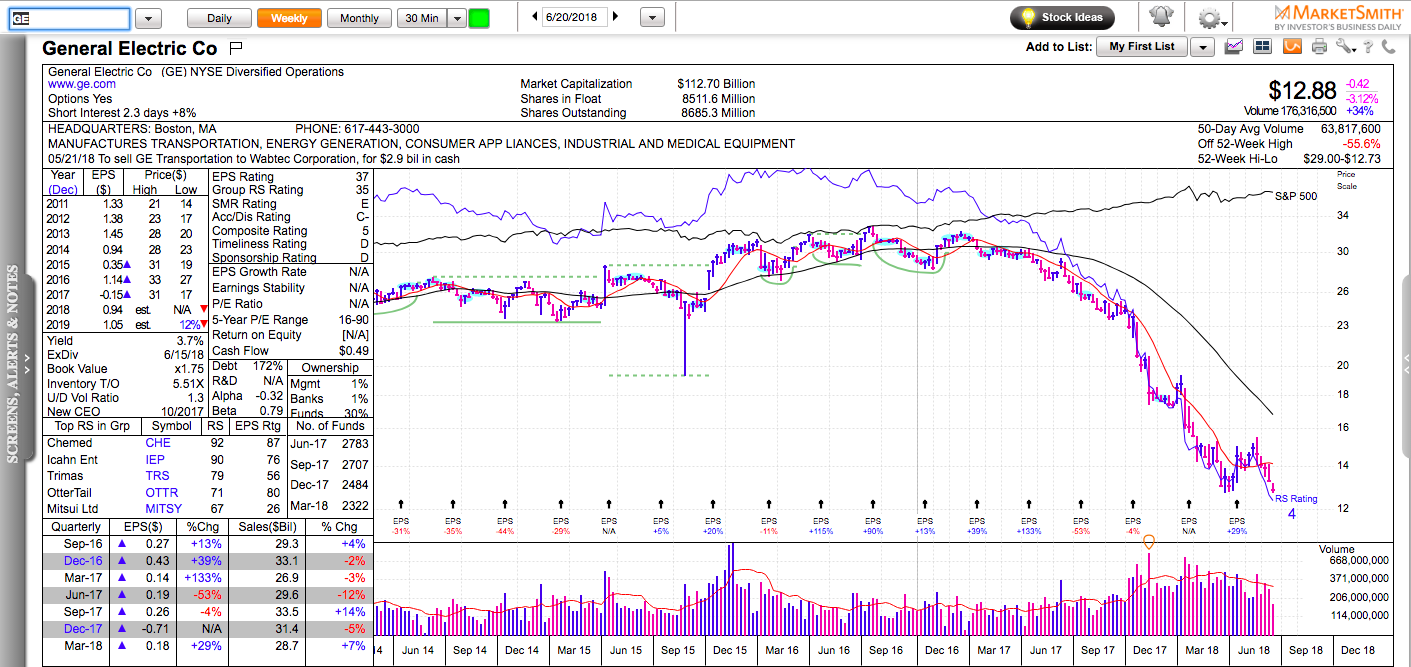
GE has just lost its spot on the Dow 30. Walgreens will replace it. This should not come as a big surprise. Its stock has been in a disarray for quite some time. It is down about 60% for the past 18 months.

You would not believe how many people told me they were buying GE at 25, 20, 18, and 15 because “it has become very cheap and it will come eventually back”. Maybe, it will recover to all-time highs one day. Maybe, it will take many years to do so and you will get tired of waiting.

Not all individual stocks recover from a big drawdown. Many remain dead money for decades to come. There is a big difference between individual stocks and stock indexes.

Indexes usually come back because they are diversified and they cut the losers (remove stocks which market cap has fallen below a threshold level) and add potential winners (add stocks which market cap has risen above certain threshold level). The current minimum threshold for the S&P 500 is $6.1 Billion.

The most popular stock indexes in the U.S. are basically long-term trend following systems in disguise. I sometimes joke with passive investors (indexers) that they are actually trend followers who don’t want to pick stocks.

Buying 52-week lows in a bear market is understandable if you are a value investor. Most stocks take a big hit during market corrections and the good is thrown out with the bad.

Buying stocks making 52-week lows in a raging bull market is a completely different story and it often doesn’t end well. If a stock keeps plunging while the rest of the market is advancing there’s is usually something very wrong with it and it is likely to continue lower. You can save yourself a lof headaches if you ignore the 52-week low list during bull markets.

Most people will be better off waiting for a beaten-up stock to build a new base and break out to new 52-week highs before they enter. A new 52-week high in a crushed stock might still mean 50% below its all-time highs.

When you buy a new 52-week high in a heavily neglected stock, you achieve two things: you have momentum on your side and you have plenty of people who don’t believe in the stock, which is good because those same people are a future source of demand.

Momentum Monday – Stock Pickers’ Market

Charts in this post are powered by MarketSmith.

Even the minor dips in the major U.S. stock indexes keep getting bought. Google, Apple, Amazon, Facebook, and Netflix are at or near their all-time highs. In the meantime, emerging and most foreign markets continue to struggle below their 200-day moving averages. The divergence between U.S.and foreign stocks in 2018 has been astounding. It cannot be explained only with the strength of the U.S. Dollar, which is barely up year-to-date: +2.9%.

The IPO market is on absolute fire. It hasn’t been this hot since 2013 when we saw a bunch of biotechs doubling and tripling in a very short period of time. This time, the heroes are software stocks.

We cover the following tickers: QQQ, ETSY, MELI, EEM, EWG, TWLO, TWTR, ADSK, SFIX, etc.

Disclaimer: everything on this show is for informational and educational purposes only. The ideas presented are not recommendations to buy or sell stocks. The material presented here might not take into account your specific investment objectives. I may or I may not own some of the securities mentioned. Consult your investment advisor before acting on any of the information provided here.

Why Momentum Investing Is A Contrarian Approach

Charts in this post are powered by MarketSmith.

The two biggest errors in bull markets are usually errors of omission. Not buying a stock because it is up too much too fast or not buying a stock because you sold it at a lower price recently.

If you bought something at 10 and sold it at 14, the odds are that you are not going to buy it back at 20. Even if the new setup looks incredible, it will be like chasing to most. This is why momentum investing is a contrarian approach and it continues to work. It seems easy only in hindsight, but it is never so when you have to apply it in real time.

People need time to adjust to new prices. When a stock goes from 40 to 160, it seems extremely expensive to everyone. It takes spending a considerable amount of time in that new price range, for people’s mental model to change. This is why many momentum stocks build new bases after a considerable recent run.

The typical momentum stock goes through 3 distinct stages:
1. Price leads – expectations for a brighter future attract buyers and a company price appreciates very quickly mainly because of a P/E expansion. The market is willing to pay a higher price for the expected earnings. FOMO (fear of missing out), short squeezes, and the overall market sentiment also have a big impact. An optimistic market might be willing to pay several times higher price than a pessimistic market for the same earnings growth.
2. Price spends some time in a range while earnings growth catches up with the market expectations. The market made a bet for a brighter future in stage one and now the company needs to prove the market right by delivering strong earnings growth. If a company fails to meet the market’s high expectations, its stock might quickly decline 50% or more.
3. Price growth and earnings growth go hand in hand.

NVDA might be a typical example. It had a huge run in 2016-2017. It seemed expensive all the way from 40 to 200. Then, it spent 6 months in a range and now it is setting up again near its all-time highs. $300 is very possible scenario by the end of 2018.

Disclaimer: everything on this website is for informational and educational purposes only. The ideas presented are not recommendations to buy or sell stocks. The material presented here might not take into account your specific investment objectives. I may or I may not own some of the securities mentioned. Consult your investment advisor before acting on any of the information provided here.