The Perfect Portfolio

Imagine if there was a way to know the best performing stocks of each year ahead of time? According to Patrick O”Shaughnessy from Millennial Invest, if you had invested in the 25 best performing large caps of each year, you would have compounded your capital at 80% for each of the past 80 years. Sounds impressive, right? The only problem is that no one has a crystal ball that tells the future.

Mr. O”Shaughnessy looked into the common characteristics of the winners. His conclusion is that they did not have anything in common and it was impossible to identify them ahead of time with any degree of consistency. The 25 best performing large cap stocks of each year were equally likely to be super cheap or super expensive in terms of Price to Earnings Ratio. Earnings growth and price momentum were also not a big help for revealing the best future performers.

For the purposes of his research, O”Shaughnessy considers a large cap stock one with market capitalization above the average in the market. Market capitalization is the product of a stock price and total shares outstanding.

“Last year’s “perfect portfolio” would have included Facebook, Tesla, Delta Airlines, Netflix and Alcoa among others. These companies came from all different corners of the market, and many would have doubled your money in just one year”, says O”Shaughnessy.

It is true that the best performers of last year come from different industries and on a first look have very little in common, but if you dig deeper you will something quite intriguing. All of these stocks reported much better than expected earnings and as a result they gaped to new 52-week highs. More precisely, all of those companies reported several consecutive quarters of better than expected earnings.

On our site, SocialLeverage50.com we keep a list of 50 high-growth stocks, which we update every week. If you take a deeper look at the SL50 list, you will notice that many of the stocks there have crushed earnings estimates and received positive market reaction. One of the most enduring market edges is the so called Post Earnings Announcement Drift – the tendency for a stock to drift in the direction of an earnings surprise for several weeks (even several months) following an earnings announcement. Earnings surprises are also one of the main ingredient in our equity selection process.

Source: THE PERFECT PORTFOLIO by Patrick O’Shaughnessy
When Negative Divergences Are Actually Positive

2014

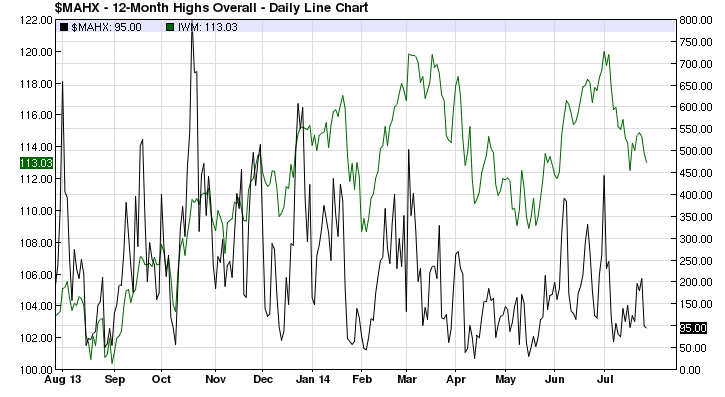
Bull markets climb a wall of worry. Financial pundits’ favorite sport is top-calling. Over the past year, a lot of digital ink has been spilled on the so-called negative divergences. Many have pointed out that the Nasdaq Composite’s new multi-year high is not sustainable, because of the rapidly decreasing number of stocks, making new 52-week highs. This is what all technical books say. Maybe, at some point, this divergence will matter. In the meantime, it won’t hurt if you look at market breadth from a different perspective. Not always, but more often than not, extreme breadth leads to mean-reversion.

Take a look at the chart above, which plots Russell 2000 (in green, small cap index) against the number of total 52-week highs (in black). Any time in the past year, when the black line dropped below 50, there was a stock rally afterwards. Almost any time the black line went above 500, there was a pullback in small caps.

Granted, we should not judge the reliability of one indicator based on just one year of data. Any indicator that works great in a bull market might be totally useless in a bear market.

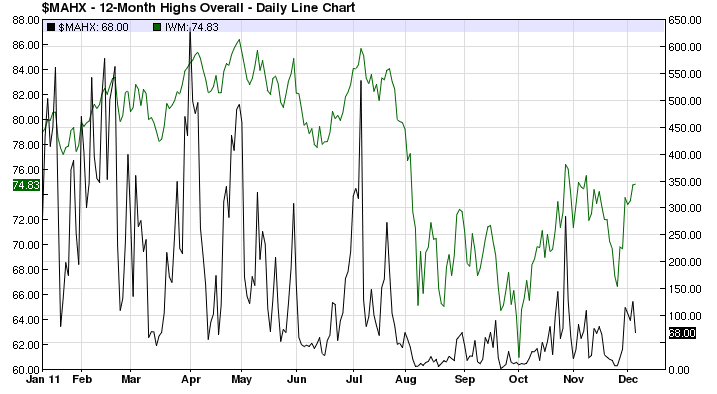
The last big market correction was in 2011, when inside of three months Russell 2000 lost 30%. The number of 52-week highs indicator was irrelevant market timing tool then.

2011

From my perspective, the most practical indicator of market health is the number of great risk/reward long setups and how they act after they break out. Lately, the most appealing setups have been concentrated in emerging markets (mainly China) and large-cap U.S. stocks. It is a market of stocks environment, where there are plenty of opportunities for both bulls and bears.

logo_dark

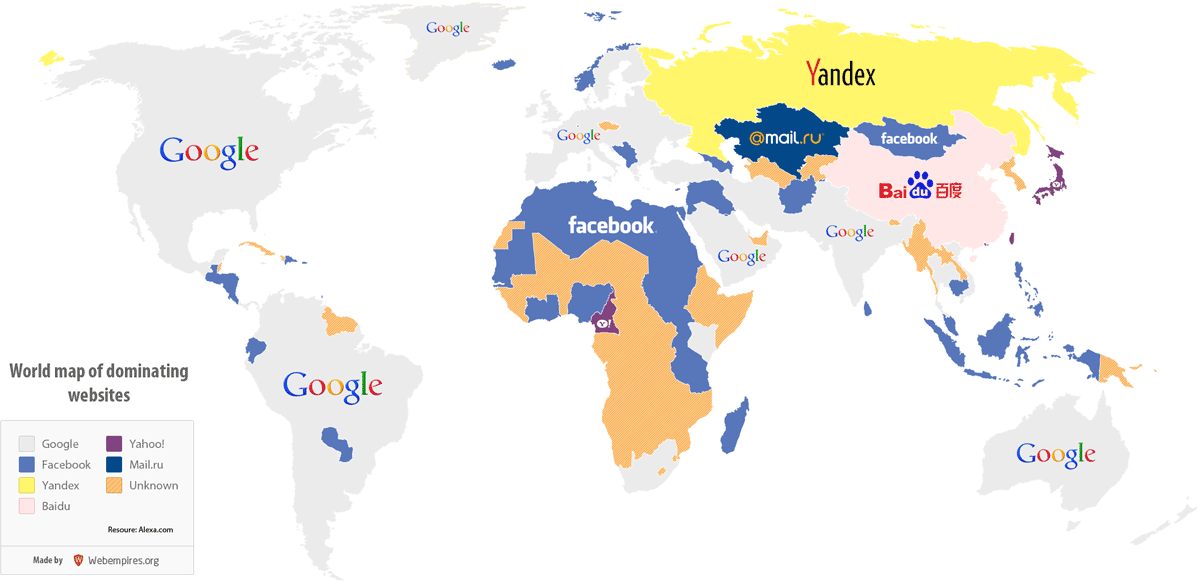
The Most Visited Web Site In China Is Up 8000% Since Its IPO

Most-Visited-Websites-In-The-World-MAP1

Chinese search engine, Baidu crushed estimates again and its stock is trading at new all-time highs near $220 this morning.

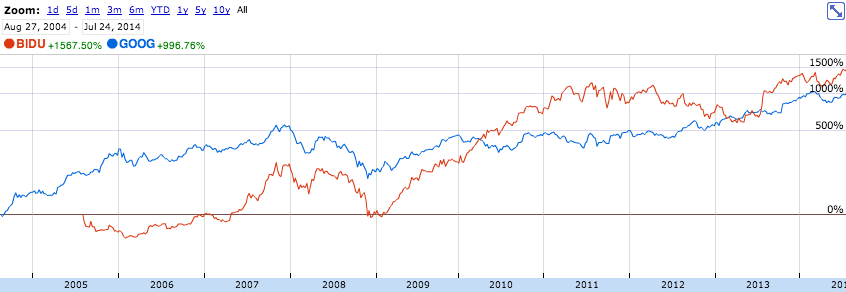
BIDU IPO-ed in 2005 at $27 per share, which is 2.70 on a split-adjusted basis. They had a 10:1 split in 2010. It was considered the hottest IPO of the year. $BIDU gained 350% on its first trading day, finishing at $112.5 (12.25 split-adjusted).

bidu

Over the past decade, BIDU never looked cheap. It was trading at a high P/E multiple all-the way from 2.70 to 220. Don’t be afraid to pay up for high-growth stocks with great potential. In many cases, they are expensive for a reason. Over time, earnings could more than catch up with people’s expectations and justify high valuations.

This is exactly what happened with Baidu. In the quarter before its IPO, it earned $8 million. In its latest 2014 quarter, Baidu earned $571 million.

The market is a voting machine in the short-term and a weighing machine in the long-term. Valuation matters in the end only if earnings don’t catch up, you plan to hold forever and you don’t have an exit strategy. If price gets you in a trade or investment, price should get you out. If you don’t know why you are in the trade, you won’t know when to exit.

logo_dark