Why and how buying pullbacks in momentum stocks work?

Most market edges come and go and don’t last long. One of the few market edges that have survived the test of time is momentum. The momentum phenomenon has been tested on multiple asset classes in various geographic markets. Hundreds of white papers have been written on it. They all conclude the same thing – it continues to work. I am not going to go into details how and why it works, but here is a quick summary that might spark your interest to further investigate and create your own conclusion:

  • Medium-term momentum works. The best-performing stocks for the past 6-12 months usually outperform as a group in the next 6-12 months. Studies show that most of the momentum phenomena due to industry momentum (similar stocks tend to move in groups) and the 52-week high (it is an important benchmark watched by many).
  • The worst-performing stocks for the past 6-12 months tend to underperform in the next 6-12 months. There’s one exception. Things turn upside-down in the month of January when the worst performers tend to shine.
  • Long-term momentum (3 to 5 years) and short-term momentum (1-4 weeks) tend to lead to mean reversion.

There are two basic ways to trade momentum – buying a breakout or buying in anticipation of another leg higher. Swing traders are more interested in the latter because it provides better risk/reward ideas.

Why and how buying pullbacks in momentum stocks work?

  1. Many algos are programmed to buy near rising moving averages.
  2. It is easier and more lucrative to accumulate a big position on a slight weakness; therefore it is the preferred way for institutions.
  3. People who sold their stocks too early have a hard time buying them at higher prices, so they are a lot more likely to step back on a pullback.
  4. People who have missed a move and are afraid to chase are waiting for a pullback to buy. That pullback might never materialize, but if it does, they will be there to provide liquidity.
  5. The short-sellers who haven’t been squeezed out of their positions are likely to cover on a pullback to a rising 20, 50, 100-day moving average, year-to-date volume-weighted moving average or on the first sign of renewed strength.
  6. All of the above-mentioned is usually enough to
    a) stop a pullback
    b) create a tight-range candle
    c) create a slight bounce.

Such price action within an established uptrend attracts the attention of swing traders, who pile on. Their buying leads to a new leg higher, which often surpasses the previous high.
Is Using Incomplete Weekly Charts A Chart Crime?

Some technical purists claim it is wrong to look at a weekly chart before the week has been completed. For example, you should not be looking at weekly charts on a Tuesday and make your decision based on them because the week isn’t over yet. I understand that perspective but I don’t agree with it.

Weekly charts eliminate the noise and show the big picture. They let you see trends and ideas that you can dismiss on a daily or an intraday chart. Looking at a weekly chart on a Monday can give you a headstart of what it could be.

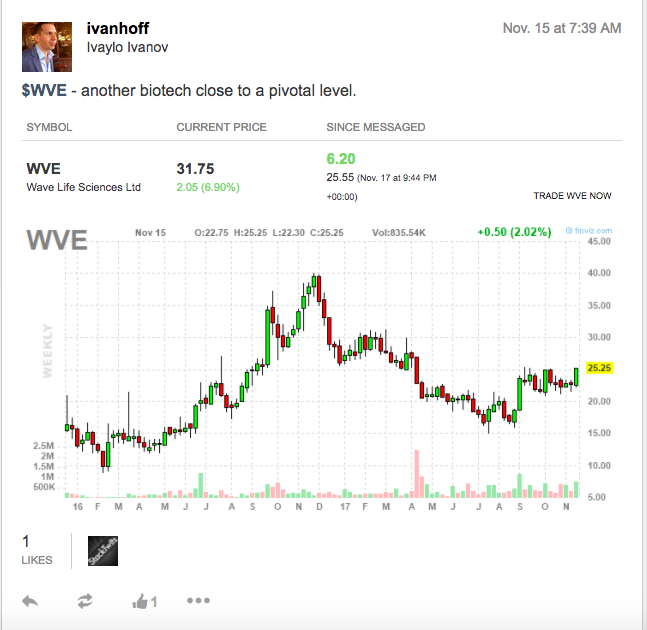
For example, I posted this chart of WVE on November 15 (Wednesday):

This is how WVE’s weekly chart looks at the end of the week. The setup and the risk to reward are completely different.

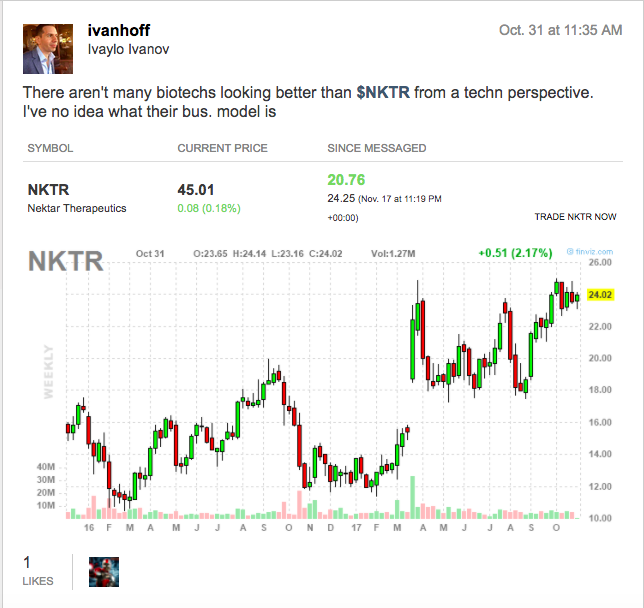
I posted this chart fo NKTR on Oct 31 (Tuesday).

You get the point.

Are All Analysts Useless?

“You don’t need analysts in a bull market, and you don’t want them in a bear market.” – Gerald Loeb

People like to mock sell-side analysts and point out how little value they add. Their calls are often too late, biased, and sometimes – contrarian signs.

Is it really too late to downgrade a stock after it has fallen 70% in the past two years? It depends. Stocks that make new 52-week lows in a bull market are usually there for a good reason. They can often keep going lower. For reference, check in the price action in coal stocks in the past few years.

A lower stock price can actually worsen a company’s fundamentals. For many, fundamentals only involve earnings and sales growth, assets minus liabilities, current and expected cash flow. But what’s behind all those ratios and numbers? A company’s reputation, the people that work for that company, the strategy they are pursuing, the technology they are using. All of the above form a company’s competitive advantage.

A company’s stock is essentially its currency. It’s a reflection of the market’s expectations and beliefs. If a company’s stock drops substantially, it will hurt its ability to attract and attain qualified people, which in turn will impact the service and the products it provides, the partnerships it can create, its ability to acquire promising startups and their technologies, etc. A big and continuous decline in a stock price can change a company’s fundamentals; therefore issuing a downgrade after a 70% drop might not be as mindless and useless as it appears.

The same line of thoughts can be applied to companies with rising stock prices. A considerable and sustainable increase in a stock’s price can actually improve a company’s fundamentals. George Soros’s reflexivity theory at work.

P.S. My twitter account @ivanhoff has been hacked and I don’t have access to it anymore. The gmail associated with it has been deleted, so I cannot recover it. How did they get access to my gmail? They called my telecom and pretended to be me, so they managed to transfer my phone number to their sim card for a few hours. Maybe, I should write a post about how to better protect yourself. I learned a lot about it in the past week. Anyway, my new twitter handle is @ivanhoff2. On StockTwits, I am still @ivanhoff.

Also, my book Top 10 Trading Setups is a great gift for the upcoming holidays.