There is a lot of placebo effect in capital markets. Just like the price of Nike sneakers consists of tangible value (they provide all the benefits other sport shoes provide) and intangible value (the fame of the brand), the price of any stock reflects underlying fundamentals, expectations about future growth and current sentiment. Each of those three elements can have a positive or negative contribution towards the price of any stock at the different stages of its life cycle.
Investors often act on expectations of how certain events and processes will affect prices. Those events might not change the underlying fundamentals at all, but they can change expectations. When expectations change, prices change. When prices change, expectations change. Yes, some catalysts can start a process of self-reinforcing feedback loop. It works in both directions – up and down.
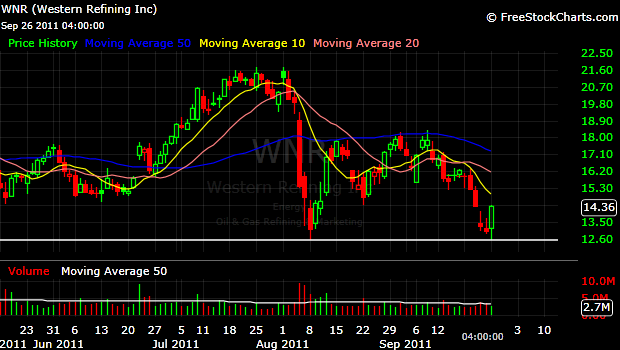
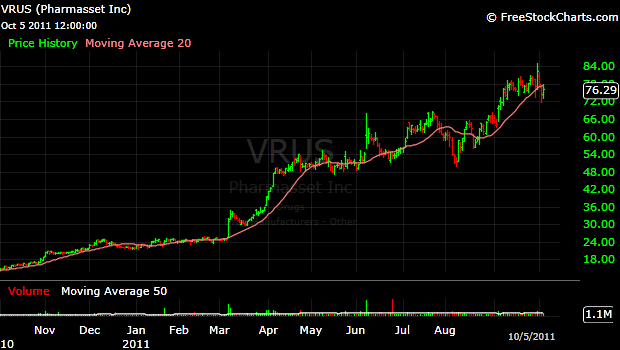
Technical levels (previous zone of support and resistance, recent bottoms and tops, Moving averages) are not events in the typical sense of the word, but they also impact expectations.
They often work as self-fulfilling prophecies – when enough eyes are looking at the same level and act, expectations could turn into reality.

It doesn’t always work so flawlessly and honestly often such obvious levels of potential buying interest don’t work at all.
Such types of mean-reversion trades are alluring for their good risk to reward, but they can be really tricky. Stocks will often overshoot the obvious levels only to stop a good number of market participants and reverse higher. In other cases, they will reverse higher a few per cents before the obvious level of potential support is reached. leaving behind those who waited for that level.
In general, mean-reversion setups are dangerous. You need to know your weaknesses very well and practice flawless discipline to even consider playing them. Small stops provide good risk to reward, but will take you out often in such setups. Mental stops could be disastrous for those who can’t act on them. Overall, it is better to not play mean reversion at all or to play it with very small positions.

