When In Doubt, Stay Out

When an event repeats frequently, it becomes a pattern. A pattern, in which a lot of people wholeheartedly believe in and act upon. Buying oversold dips in the major indexes has been very lucrative in the past few quarters. Even more so, in the past few months, which have been a poster child of range-bound markets. Will the current dip be any different? No one really knows. There are some good reasons to believe so:

– seasonality;

– poor reaction to decent earnings reports;

– lack of great long setups;

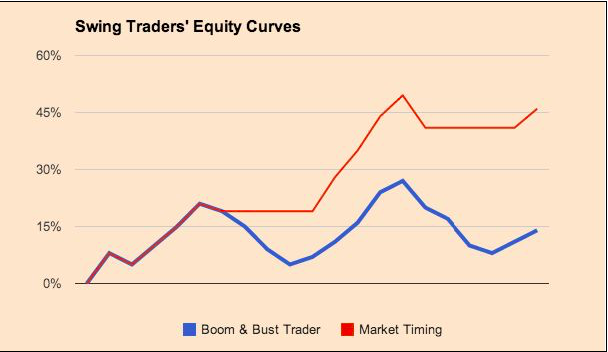
When in doubt, stay out. When there are both good bullish and bearish arguments, it is better to give priority to capital preservation. If we flatline our equity curve during choppy periods by minimizing our drawdown, we could grow our capital a lot faster. Here’s a chart from a book I published last year – The 5 Secrets To Highly Profitable Swing Trading.

1

I truly believe that knowing when to be out of the market is the single most valuable trading skill anyone could develop. Why do I think so? Because, when markets are trending most setups work, most breakouts work and have a decent follow-through, it is a lot easier to make money. When markets are choppy, everything turns upside down and it is becomes difficult not to lose money. Be aggressive when it pays to be aggressive. Make sure you don’t give back most of your gains when the market environment worsens for your approach. For better of for worse, financial markets are one of those business fields, where working smart always trumps working hard.

The Science Behind Achieving High Market Returns

What does it take to achieve 20% return in a year?

Let’s make a few assumptions first. Then we are going to elaborate on why and how.

Initial assumptions:

60% win rate; therefore loss rate is 40%
average winner: 10%
average loser 5%
average position size (capital allocation) = 7%
average holding period = 5 days

What is the average contribution of each trade taken under this approach:

Capital allocation * [(win rate*average winner)-(loss rate*average loser)]

7%*[(0.6*10%)-(0.4*5%)] = 0.28%

The average contribution per trade is 0.28% of total capital.

This means that in order to achieve 20% annual return, we need to take 20%/0.28% = 71 trades per year

Or about 1.4 trades per week

There are 5 Major Ways To Improve Our Performance:

1) Improve our win ratio – some might say that at 60% it is already too high and there is not a lot of room left for improvement. The win ratio is not static. It could change substantially over the year, depending on the market environment. If you know that under certain circumstances your win ratio drops below 50% and your average winner becomes smaller than your average loser, with other words your system loses its edge – then it makes sense not to trade at all during such environment.

For arguments sake, let’s assume that you could drive your win ration to 70%, while keeping all other factors the same:

The average contribution per trade becomes: 7% [(0.7*10%)-(0.3*5%)] = 0.39%

To achieve the same 20% return, you will need to take about 51 trades or about 1 per week.

If you take 71 trades under the same system, your annual return should be about 27.7%

2) Increase the average size of our winners – it depends on market environment and holding period. Increasing the size of winners might requires using wider stops and therefore increase the average size of our losers. Holding longer might decrease the overall number of trades we could take.

For arguments sake, let’s assume that your average winner become 12% and everything else remains the same.

The average contribution per trade becomes: 7% [(0.6*12%)-(0.4*5%)] = 0.36%

To achieve the same 20% return, you will need to take about 55 trades per year.

If you take 71 trades under the same system, your annual return should be about 25.5%

3) Decrease the average size of our losers – it is already pretty low. Using tighter stops might hurt our win ratio and take us out during normal market fluctuations.

4) Trade more – when you trade a system with positive expectancy, more trades equal higher overall profits.

For example, if we take 200 trades or about 4 per week under the original assumptions, the annual return would be 56%

This is derived from average contribution per trade of 0.28% * 200 trades

Of course, trading more might lead to a decline in our win rate and in our average winner. Also, our system might not produce as many trade signals. Also, trading more has very steep opportunity cost – the time you spend trading actively is a time you could spend doing something else, which could be another source of income.

5) Allocate more per idea: the original assumption was for 7% capital allocation per idea. With the average loser at 5%, this means that our average loser is eating 0.35% or 35 basis points of the total capital.

If we bump the average allocation to 15% and everything else remains the same, then

the average contribution per trade becomes: 15% [(0.6*10%)-(0.4*5%)] = 0.6%

To achieve the same 20% return, you will need to take about 33 trades per year.

If you take 71 trades under the same system, your annual return should be about 42.6%

Capital allocation doesn’t need to be the same – it could vary depending on the asset, the market environment and the overall risk you would like to take. As a general rule, using tighter stop losses increases your position size, but it is also likely to decrease our win ratio. You have to find the best system for your life style and experience.
Empathy Gap

One of my favorite movie quotes ever is from the movie Batman Begins: “It is not who you are underneath that defines you. It is what you do.” This quote describes perfectly the biggest obstacle for most investors and the main reason why there is a distance between desired and actual results. Empathy gap is the main cause behind most trading and investing mistakes. Empathy gap is the difference between how you believe you will act under certain circumstances and how you actually act when the time comes.

Do you think you will remain calm in the face of a 50% decline in one or several of your holdings and you will ride them back to new all-time highs? Think again. Most people will give up and sell in the face of such big losses. You have to plan for your inherent human weaknesses. You need to have a clear strategy that will your protect profits and confidence.

Maybe your goal should not be to find the Next Apple. Maybe your goal should not be to find stocks that will go up 2000% in 20 years. Warren Buffett likes to marry his stocks and ride them through good and bad till death do them apart. His approach is not for everyone. A much better approach for you might be to aim at stocks that could go up 100% to 500% in six to 24 months and sell them as they violate their uptrends.

Finding stocks that have the potential to be the next Apple is easy only in hindsight. The truth is that no one could know for sure. If you could go back in time and tell Steve Jobs and Tim Cook how successful Apple would become, they would probably think you were crazy. Even they had no idea in the early 2000s.

Very few of today’s leaders will turn into the next Apple. The few that do will have incredibly volatile paths along the way. Riding those trends through their inevitable > 50% drawdowns will make the holding part pretty much impossible for most people. The good news is that there will be thousands of mini-Apples in your life as an investor; thousands of stocks that will go up 100% to 500% in a year or two. Anyone could catch 10 or 20 of them.

Some trends last several months and others several years, but eventually they all end. This is not an opinion. It is a fact. The goal of investing is to keep your profits when the inevitable correction comes.

This is an excerpt from our latest book “The Next Apple”.