Earnings Expectations Life Cycle

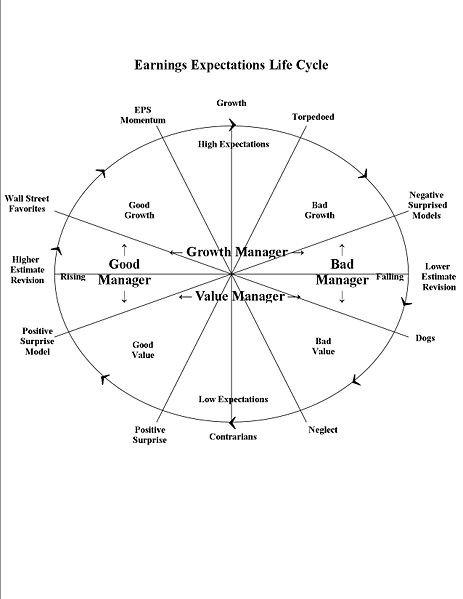
The Earnings Expectations Life Cycle is a theory developed by Richard Bernstein. It describes the dynamic process with which market participants view stocks. Despite what  we might think about a favorite stock, the expectations for all stocks follow this cycle, although those for individual stocks may not pass through every point on the cycle and expectations may go around the cycle at different speeds. In addition, stocks may go through minicycles in which they repeat portions of the larger cycle before passing to the next stage.

The Earnings expectations cycle consists of the following stages:

  • Contrarians: Market participants who invest in stocks with low earnings expectations. Most investors find these stocks unattractive or overly risky.
  • Positive Earnings Surprises: Eventually a low expectation company begins to disseminate more optimistic information. The stock regains investors’ attention. Research of such stocks may begin to increase.
  • Positive Earnings Surprise Models: Stock picking models that search for significant variations between analysts’ earnings expectations and actual reported earnings highlight stocks that enjoy positive earnings  surprises. Traditional earnings surprise models wait for actual earnings to be reported, hence the model reside in Stage 3, while the event itself may be in Stage 2.
  • Estimate Revisions: Analysts begin to raise earnings estimates in response to rising earnings expectations following the earnings surprise. Some analysts’ estimate revisions may lag the initial surprise significantly because these analysts may be reluctant to believe that the surprise is a sign that the company’s fundamental statistics are improving.
  • Earnings Momentum: Investors who follow earnings momentum themes begin to buy the stock as estimates and reported earnings continue to rise and as year-over-year comparisons begin to improve.
  • Growth: When strong earnings momentum continues for a long enough period, a stock is termed as a growth stock. These stocks are neither newly identified growth stocks (which are probably uncovered by superior growth-stock investors during stages 4 and 5), nor are they true growth companies that completely alter the business environment. Rather, most investors now agree that these stocks are indisputably superior. When everyone thinks that a stock is superior, it is time to be sold.
  • Torpedoed: An earnings disappointment occurs. The stock is torpedoed. Its earnings expectations and price sink.
  • Negative Earnings Surprise Models: The same models from stage 3, begin to highlight stocks with lower than expected earnings as potential sell candidates.
  • Estimate revisions: Analysts begin to lower earnings estimates in response to the earnings disappointment. Again some analysts tend to lag because they do not believe that earnings shortfall is a sign of fundamental problem with the company.
  • Dogs: After disappointing for a long enough period, these stocks are shunned by investors. Rumors regarding takeover, restructuring, or bankruptcy may affect the stock price temporarily, but investors generally avoid these stocks.
  • Neglect: Investors have become so disinterested in the stocks or group that brokerage firms begin to believe that research coverage of the group may not be profitable, hence coverage begins to dissipate. The lack of available research information may set the stage for a renewed cycle.
Post Earnings Anouncement Drift

The following observation was prepared by The Rivkin Report

1. It exists

PEAD has been observed by academics and finance professionals since the 1960s, but it was Bernard and Thomas’ paper in 1989 that really brought the issue to the fore. They observed that, on average, companies that announced the greatest positive earnings surprise tended to outperform the general market by 2% in the following 60 days. On the flip side, companies with the largest negative earnings surprise tended to under perform the market by 2% in the following 60 days.

2. The cockroach theory

Bernard and Thomas did more work and found that earnings upgrades / downgrades tended to come in bunches. Just like the theory of cockroaches, an earnings downgrade (negative earnings surprise) by a company is often an indicator that there are three or four more lurking in the cupboard. It often takes around 12 months for a company to “sweep out the cobwebs” and get its act together. Interestingly, there tends to be a slight reversal after those 12 months. Once a company gets back to a clean slate, it tends to surprise on the upside.

From a business cycle perspective, the theory makes sense. A company’s results simply don’t switch from one quarter to another. Good and bad trading results tend to flow on for several quarters. Furthermore, analysts who are surprised two or three times by a company’s downgrade announcements learn to factor it into their estimates, to the point where they tend to over-compensate in their estimates. After several quarters of downgrades, most executives tend to be fiercely focused on cutting costs and chasing revenue. Their jobs are often on the line, and it’s at this point in time that a company starts to surprise on the upside.

3. Market reaction is important

Most of the papers on PEAD focused on how companies exceed their previous EPS figures or the earnings estimates produced by industry analysts. The problem is that earnings announcements contain much more than pure earnings figures. Sales, margins, balance sheet items, cash flows and management commentary almost always accompany the earnings announcements.

Instead of looking at earnings numbers, Brandt et al (2008) analysed the share price movement of companies during the period one day prior to the earnings announcement until one day after the earnings announcement, as the price action incorporates not just the earnings figure, but all information. It was found that companies that produced the greatest positive share price movement tended to outperform over the next 60 days and vice-versa for companies with negative share price movement. In short, a stock that acts like a donkey around the earnings date tends to perform like a donkey for the remaining quarter!

4. The PEAD is more pronounced among small caps that miss estimates

It is possible to profit from buying companies that are announcing earnings upgrades (around 6% abnormal return around 60 days after the announcement -this figure applies for the Australian stock market). However, what is most noticeable is that companies that come out with negative earnings surprises tend to produce poor share price returns (-10% after 60 days and the price continues to slide from there). The effect is most noticeable in companies with a smaller market capitalisation.

5. Pay attention to the current market mood

One persistent trend we observe that doesn’t appear to have been captured in the various studies is that during bull markets, bad news can be easily swept aside and stock prices keep rising (and good news can be completely ignored in bear markets and prices keep dropping). It really is as simple as that. We witnessed many times in 2008 companies being sold off even after delivering solid earnings results.

Not only does one need to consider the position in the earnings cycle, but the general mood of the market.

6. Rivkin’s conclusions:

  • Don’t try and catch falling knives. Stocks that tend to drop after an earnings downgrade typically experience further declines.
  • The first earnings downgrade is rarely the last.
  • Be careful of stocks that are “priced for perfection”. Analysts will eventually over-compensate and place their estimates too high. The stock will eventually disappoint and when it does, it will be hammered severely.
  • Buy companies that perform well around the earnings announcement and sell companies that perform poorly, especially if it’s the first downgrade.
  • Don’t fight the overall mood of the market. Try and buy good news companies in good markets and sell bad news companies in bad markets.

CATALYSTS


Stock prices are moved by catalysts. There are four major types of catalysts.

1)      Liquidity: low cost of borrowing makes the investment in most asset classes quite alluring. An inflow of money makes price to go up. Rising prices bring joy and confidence to the soul of the masses. Higher confidence leads to higher risk appetite, which usually brings even more money into the stock market. This is a catalyst based on greed and vanity.

2)      Earnings’ related catalysts. If it is not about current earnings (beating estimates), then it is about future earnings (raising outlook above street’s expectations) or potential for future earnings (FDA approval, collaboration with another company, takeover rumors, announcement of new product, regulatory changes that could affect the whole industry). This is a catalyst based on momentum. The key here is market reaction. Reaction no news is more important than news itself.

3)      Valuation: I am simply not smart enough to define the intrinsic value of a stock; therefore I leave that job to the Warren Buffets of the world – people, which pocket is deep enough to survive prolonged periods of market irrationality. Who am I to say that certain stock should be traded at 18 times next year earnings or 28 times next year cash flows? Don’t get me wrong. There are plenty of smart people, who are constantly able to find stocks, trading below their intrinsic value and know how to profit from them. A big bow to them. For me their work is 50% science and 50%s art and gut feeling (experience). This is a catalyst based on common sense, but don’t forget that in trading the obvious rarely happens, the unexpected constantly occurs.

4)      Fear: of missing out on a big move or fear of getting short squeezed; fear of losing more than can afford to lose; fear of accepting that you were wrong.

I often look at the charts of stocks that make big moves in short time frame. How often? Every day, hoping that I will find out as many common patters in the beginning of those moves as I can. In hindsight, everything looks so easy. “I should’ve bought here and sold here and I would’ve made quick 10-15%”, but taking the proper decision in real time is always much harder than expected. Such fast moving stocks often experience violent corrections along their climb higher. Only the few with strong stomachs, enough experience and sound risk management behavior survive. How to overcome the fear of losing and act quickly when an opportunity presents itself? Risk smaller portion of your capital. A portion that wouldn’t hurt your confidence or sound judgment if you actually lose it. If you are risking 1% of your capital and it happens that you lose it, you only need to make 1.01% on the next trade to break-even. Can you do that? Absolutely. Then why you are afraid to take on new trading ideas, produced by your method? If you’re not able to sleep, then you are risking too much. If you are trading too often, then you are not risking enough. And one more thing. No one can buy at the bottom and sell at the top. If it happens, it is due to pure luck, not skill. Gradually build positions in equity that you like and gradually take profits when you exit.