January
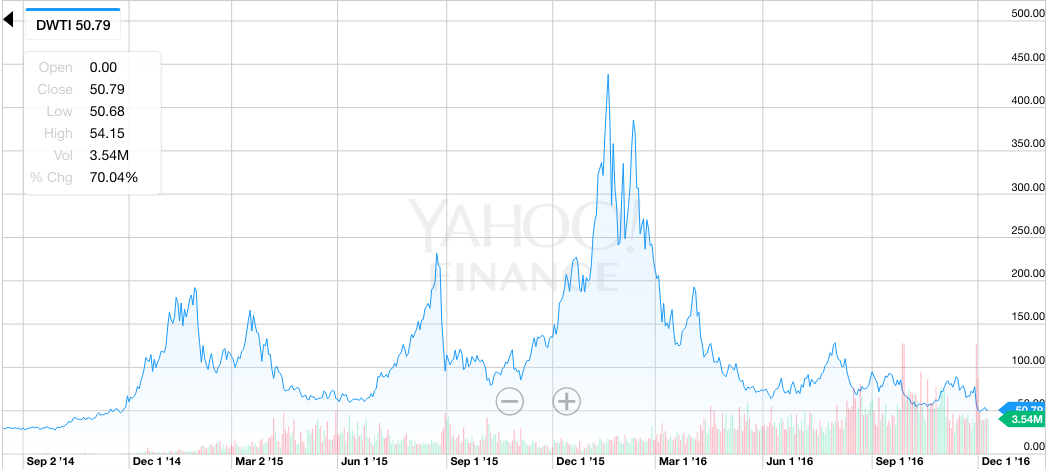
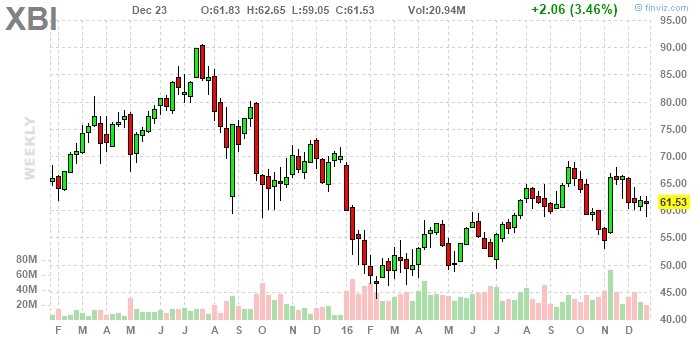
The year started with a big gap down in all stock indexes and a reminder that “oversold” and “diversified” mean little during forced liquidations. Crude oil dived lower and it took all stocks with it. The 3X inverse crude oil ETF DWTI went from $200 to $400 in three weeks. The small-cap biotech ETF, XBI was absolutely obliterated and lost 38%. My most-read posts in January were: 10 Musings about market corrections and 13 More Thoughts about Bear Markets.
A few months earlier (in September 2015) I wrote a book, explaining the different stages of corrections and how to approach them: Crash – How to protect and grow capital during corrections.
February
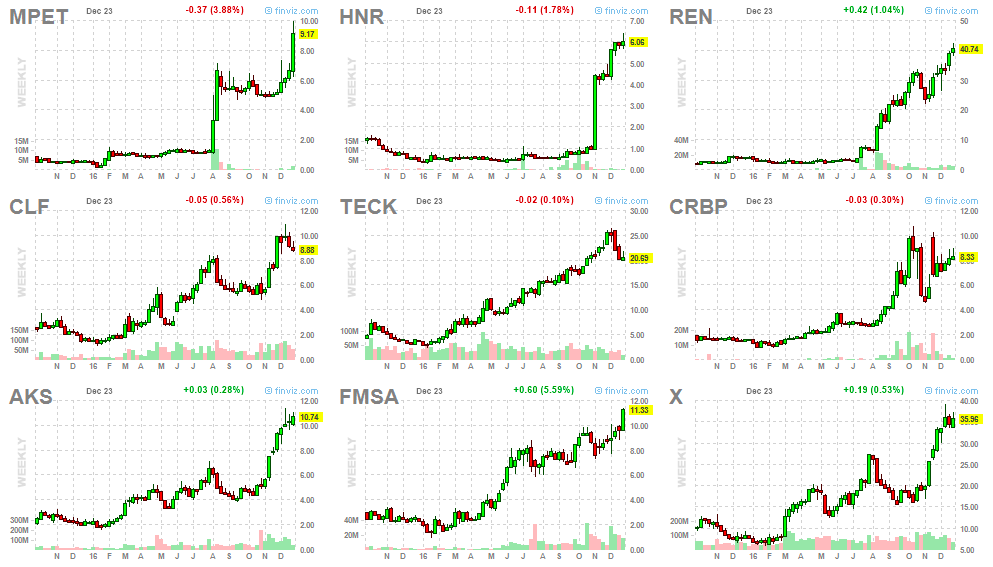
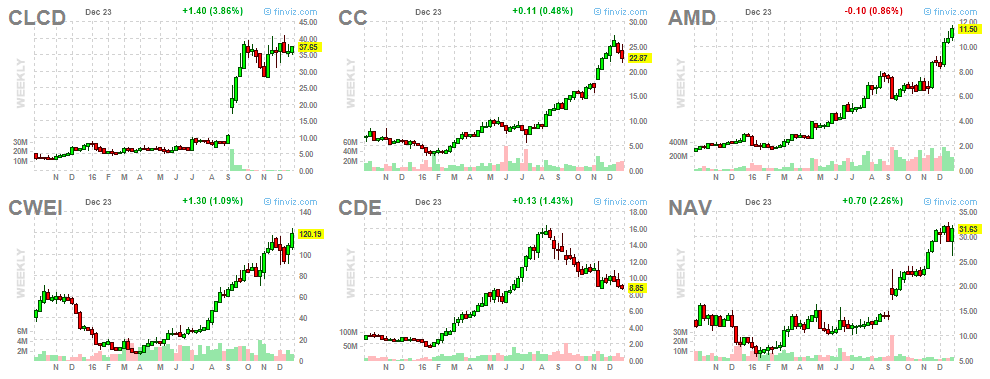
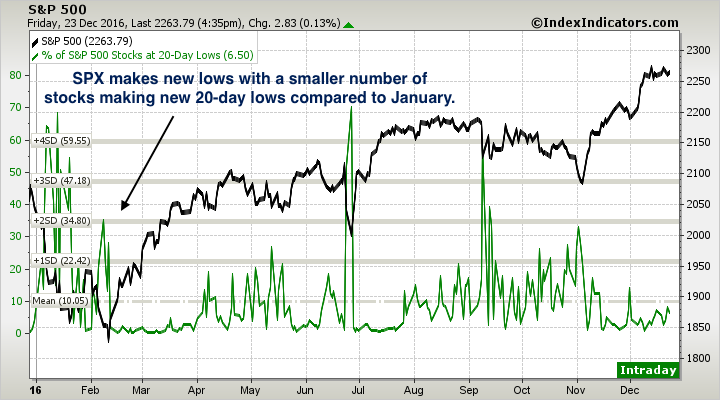
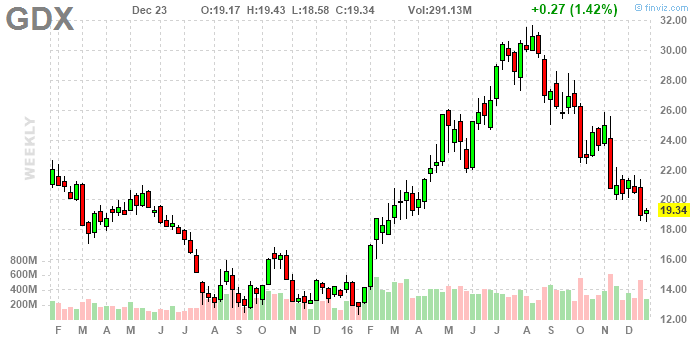
There was a major momentum divergence in U.S. market indexes which marked the bottom in U.S. indexes. Emerging markets had already bottomed in late January. Gold and silver miners showed notable relative strength early in the month and were massive outperformers during the market recovery. Small-cap miners like CDE went from $2 to $16 in six months.
My most-read post this month was The Two Best Performing Stock Groups after a Market Correction. It was spot on.
March
You don’t have to catch the exact bottom in order to benefit from a market recovery. You can wait a few weeks to see a confirmation of a new uptrend and still do incredible well as more and more sectors join a rally.
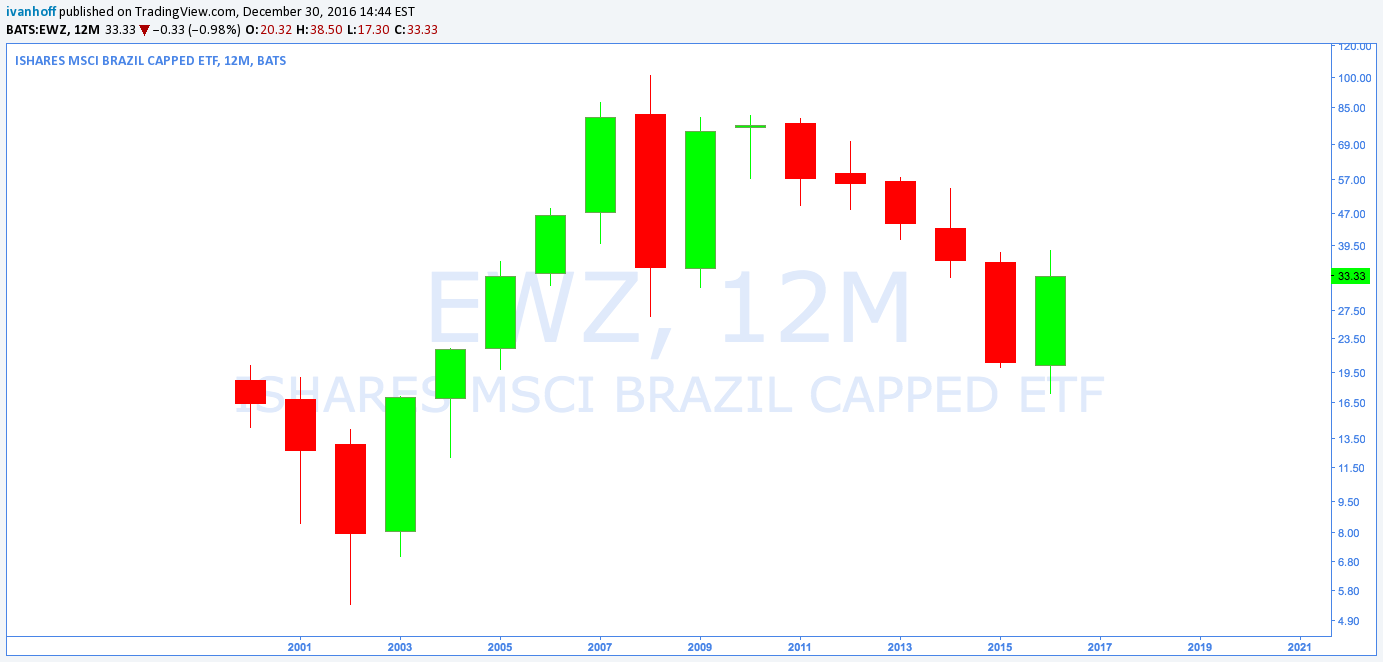
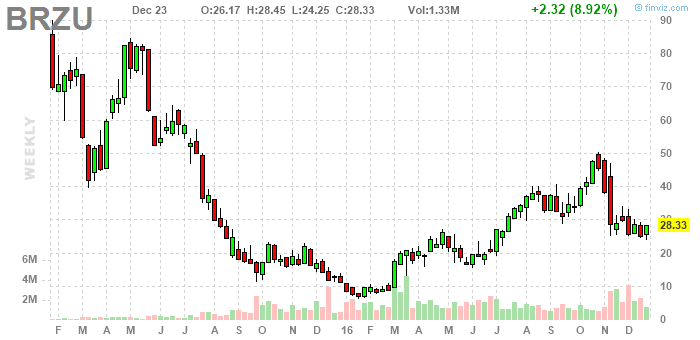
Emerging markets began a huge rally in early March. The 3X long Brazil ETF, BRZU went from $10 to $50 in in the following six months.
My most-read posts for the month were: What happens after a 10% market correction, What overbought breadth readings mean, and The Only Time to Savely Bottom-Fish.
April
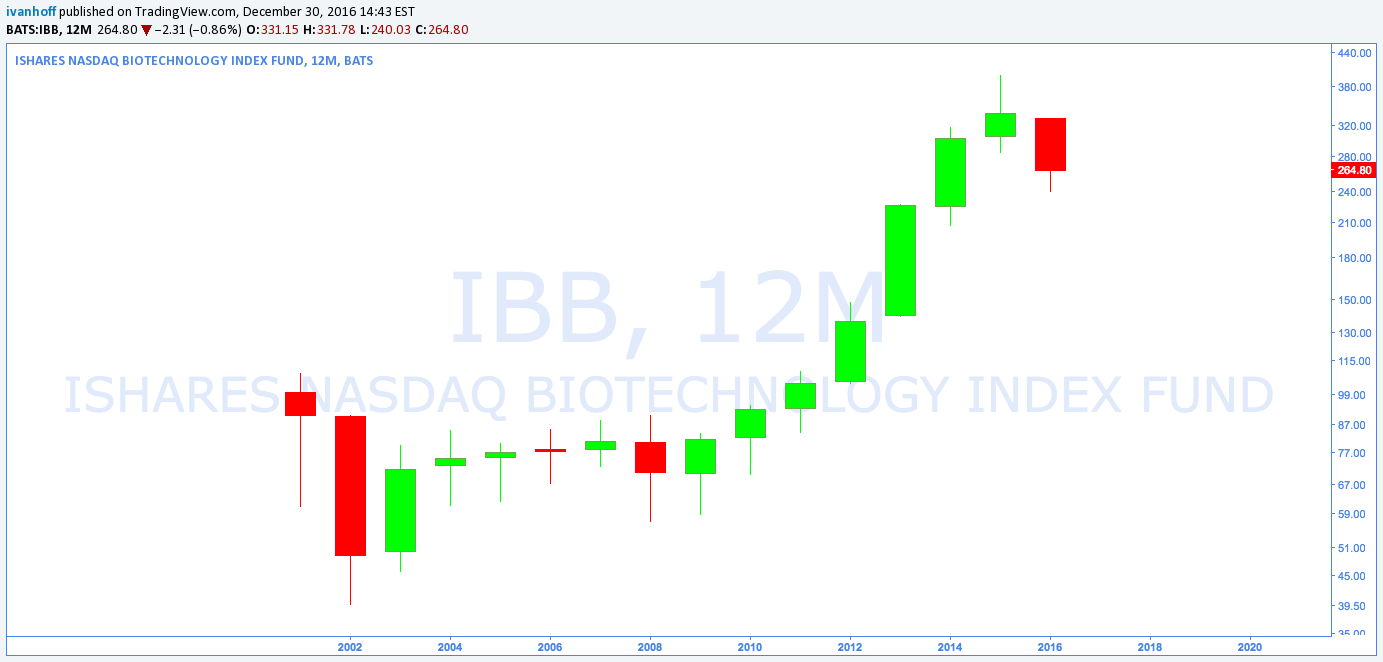
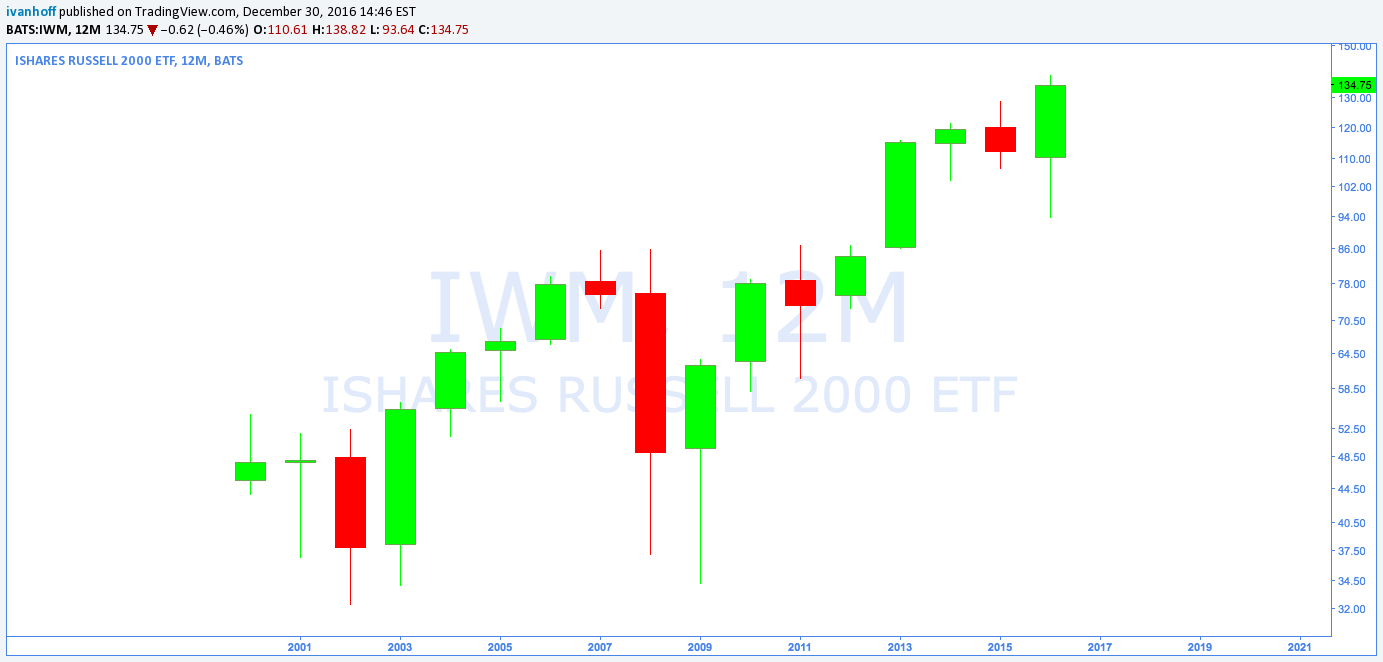
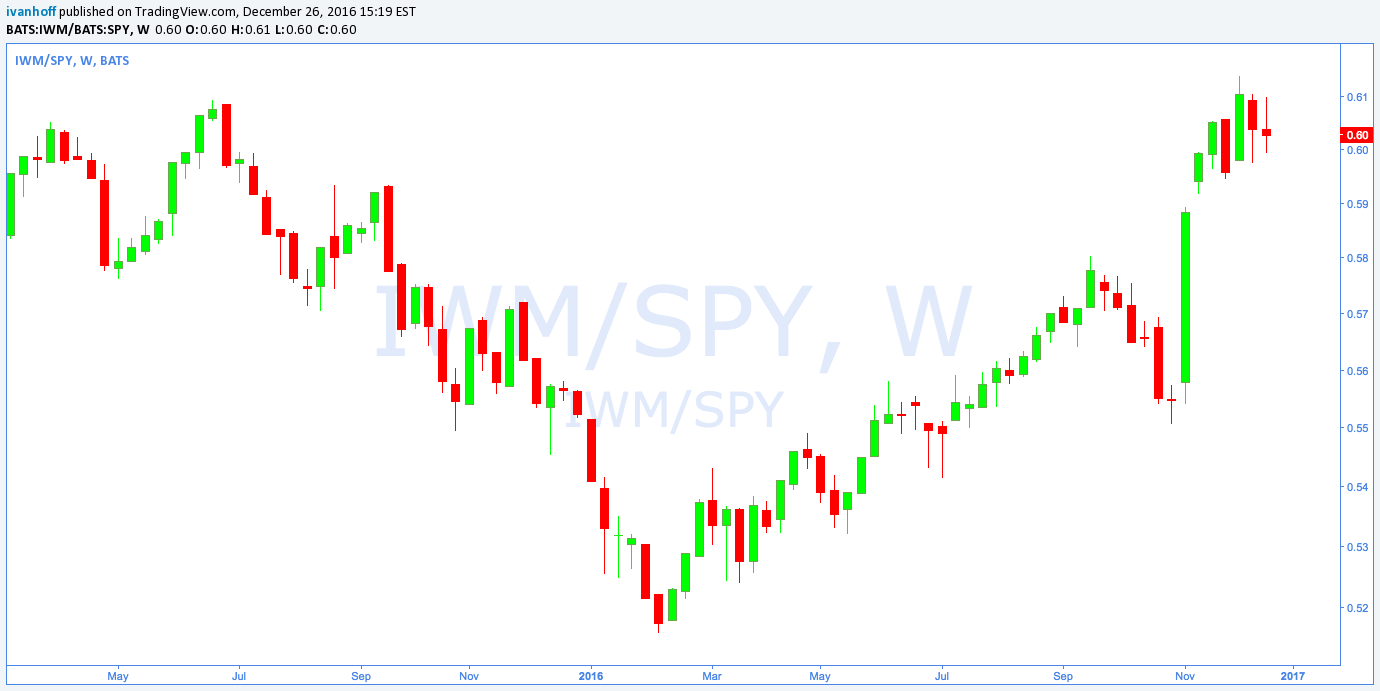
The biotech sector finally joined the bull party. Small caps started to outperform large caps.
My most-read posts for this month were: An example of a failed breakdown and Some of the Most Shorted Stocks are Setting Up for Potential Breakouts.
May
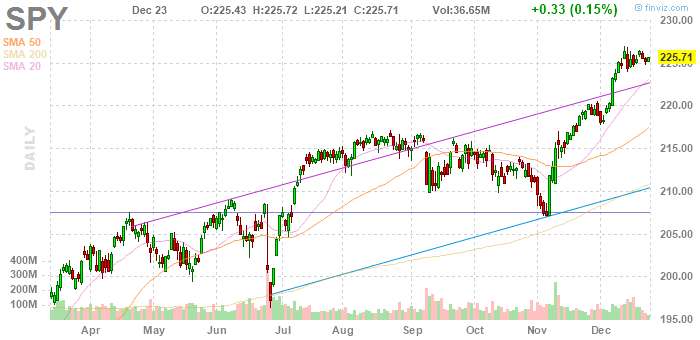
The first major pullback to a rising 50-day moving average was ferociously bought.
June
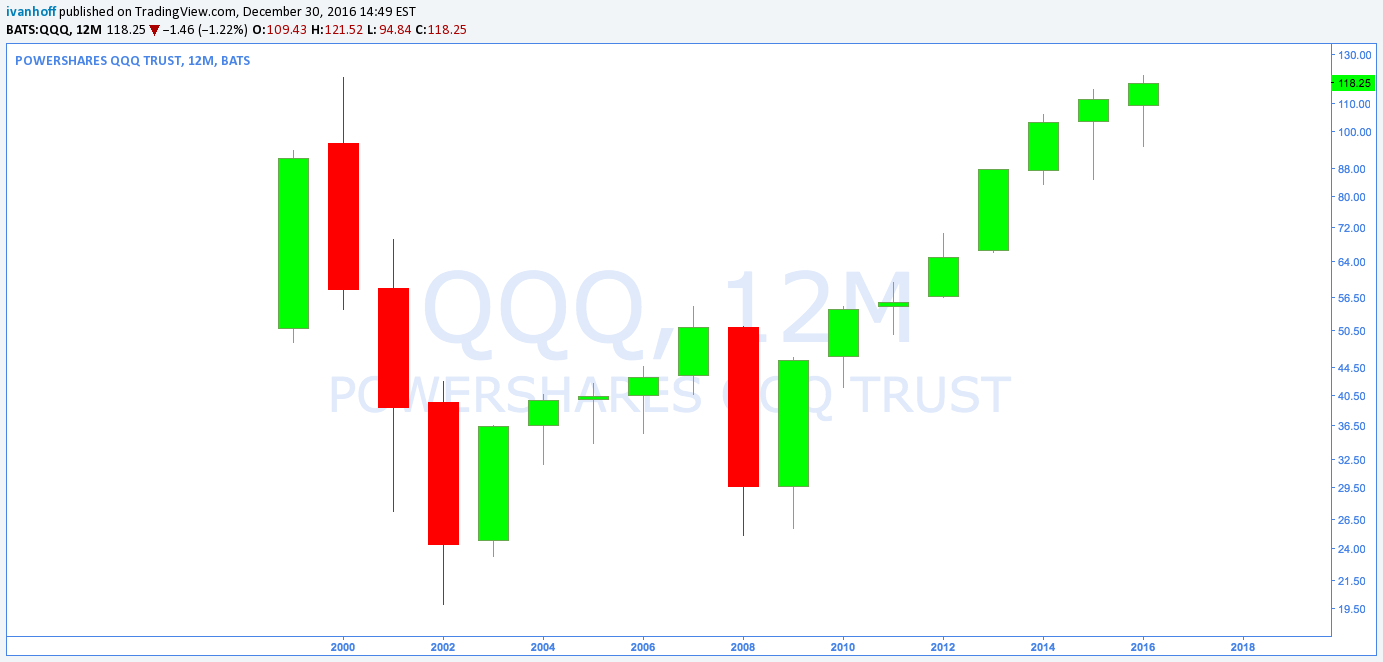
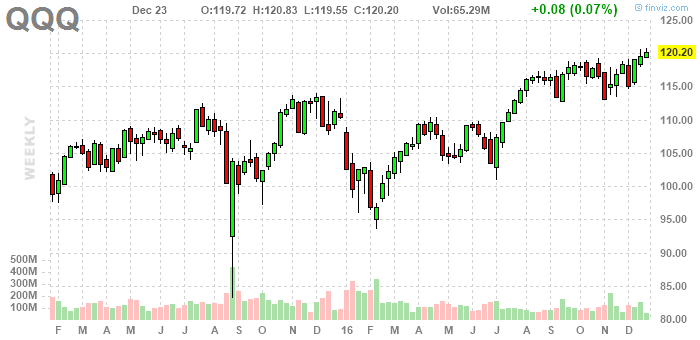
Brexit surprised the market. It led to a quick two-day crash, followed by just as quick and impressive snapback. The recovery in the large-cap tech ETF was especially striking. QQQ was at new year-to-date highs two weeks after the Brexit correction.
July
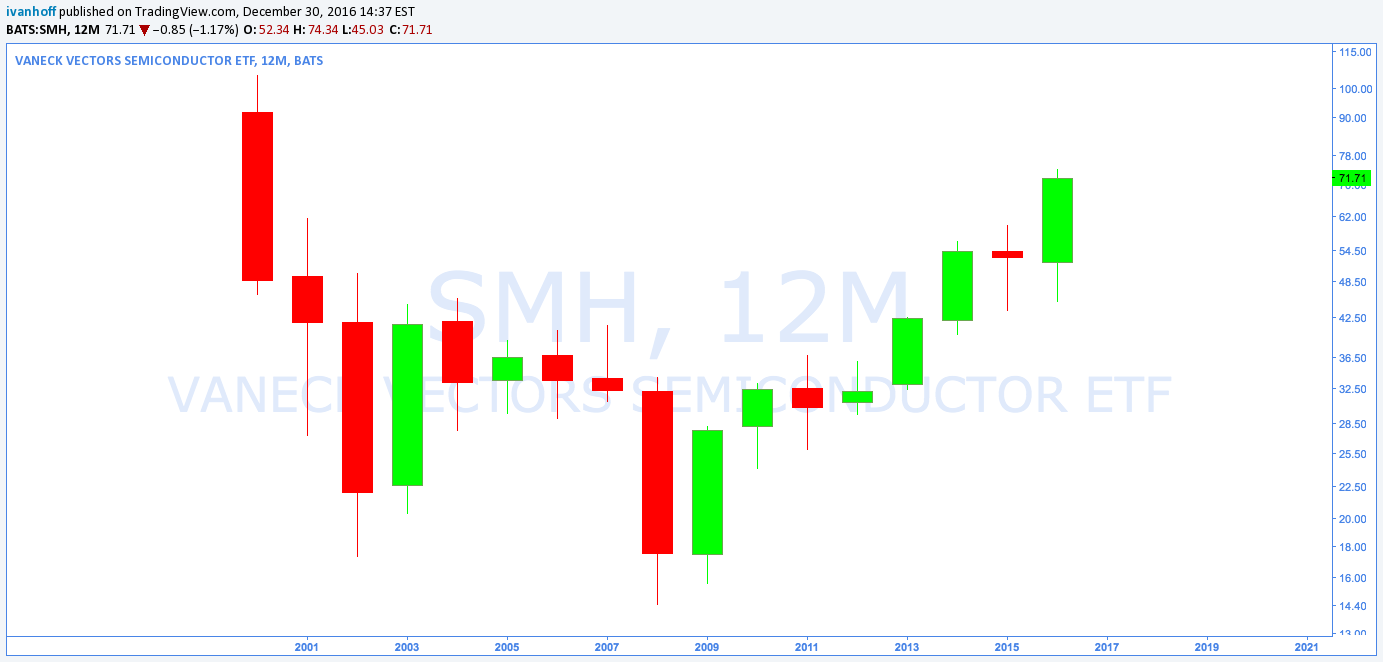
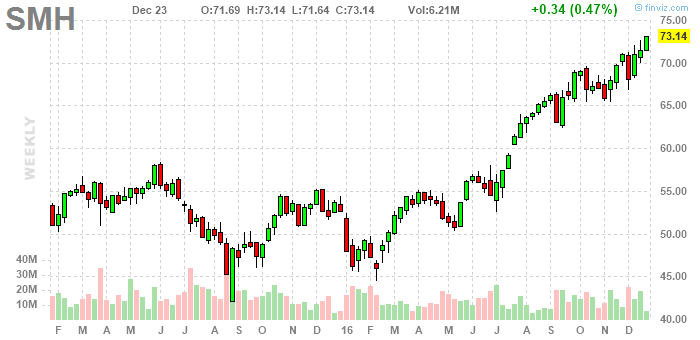
A major technical breakout in the semiconductor sector. Even if you missed the first six months of the year, July was not too late to join the market rally.
August
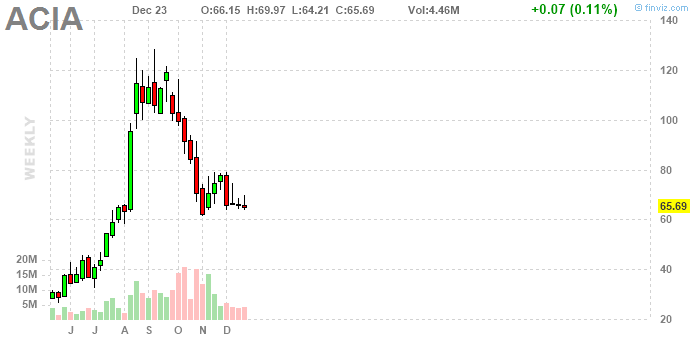
The market is in a good mood. Recent IPOs like ACIA are reaching for the sky. One of the most powerful setups is a hot recent IPO and a bull market.
September
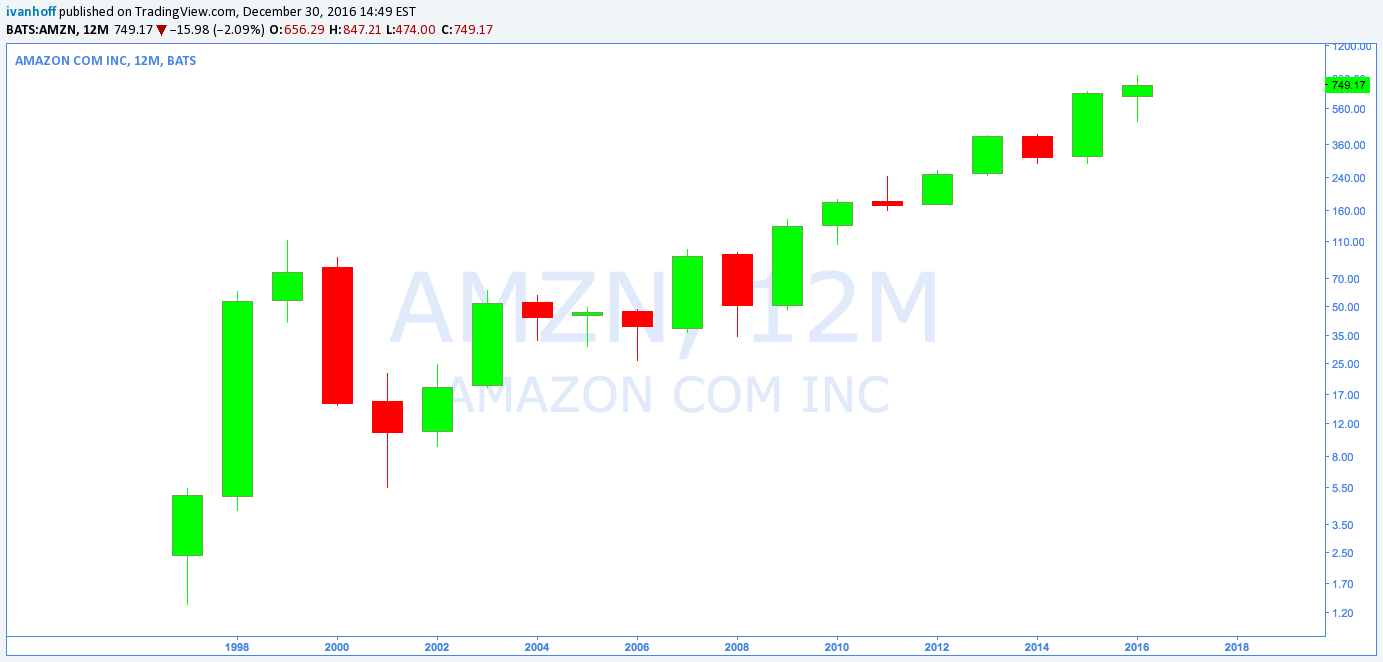
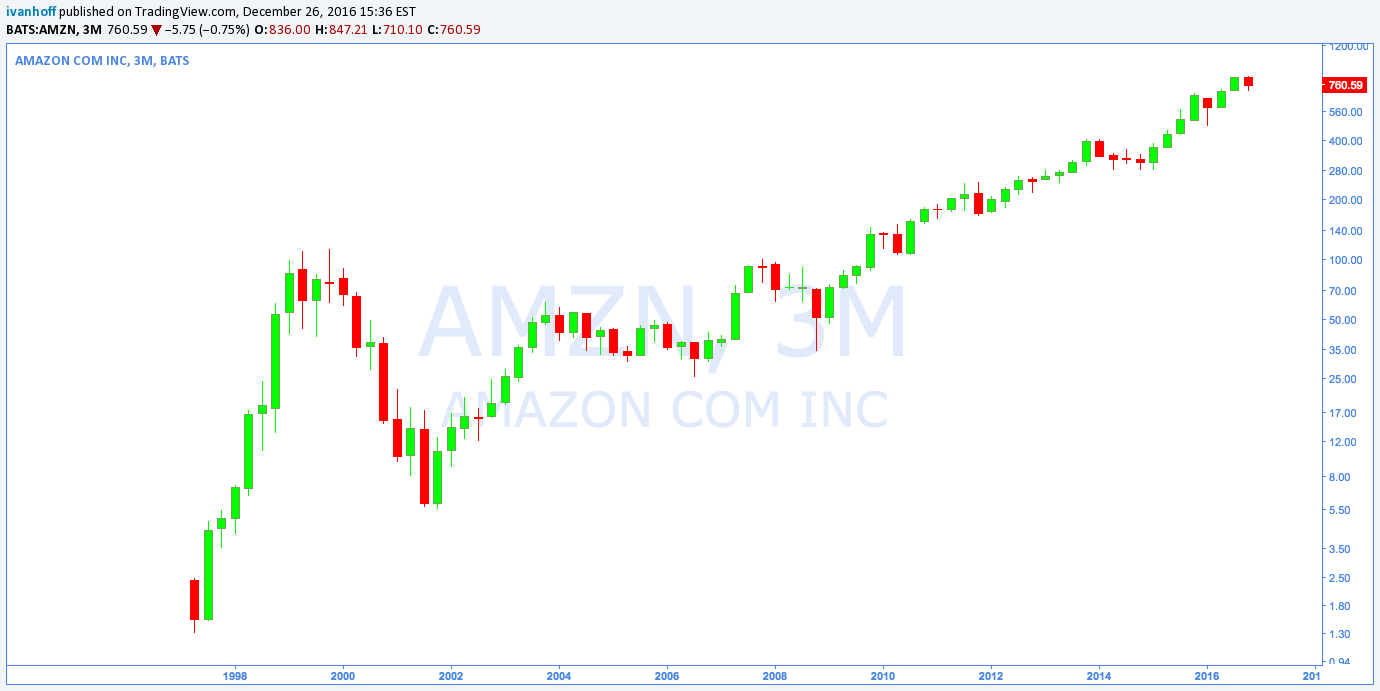
Amazon reached new all-time highs, cementing its place as one of the most incredible stock market stories. $1000 invested in AMZN on its IPO day in 1997 is worth about $440,000 in 2016. The little detail is that Amazon had a 90% drawdown in 2000.
October
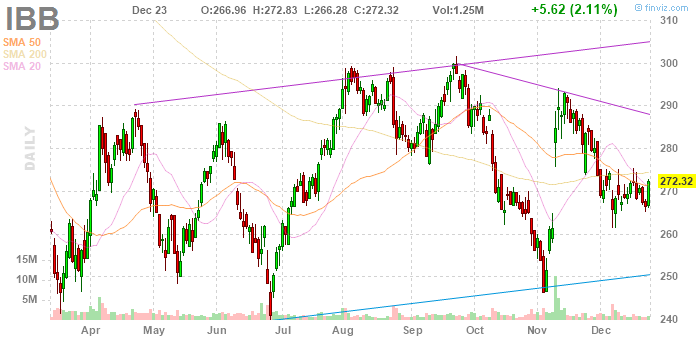
The biotech sector rolls over as the market fears the potential impact of a Clinton’s administration on drug regulations and prices.
November
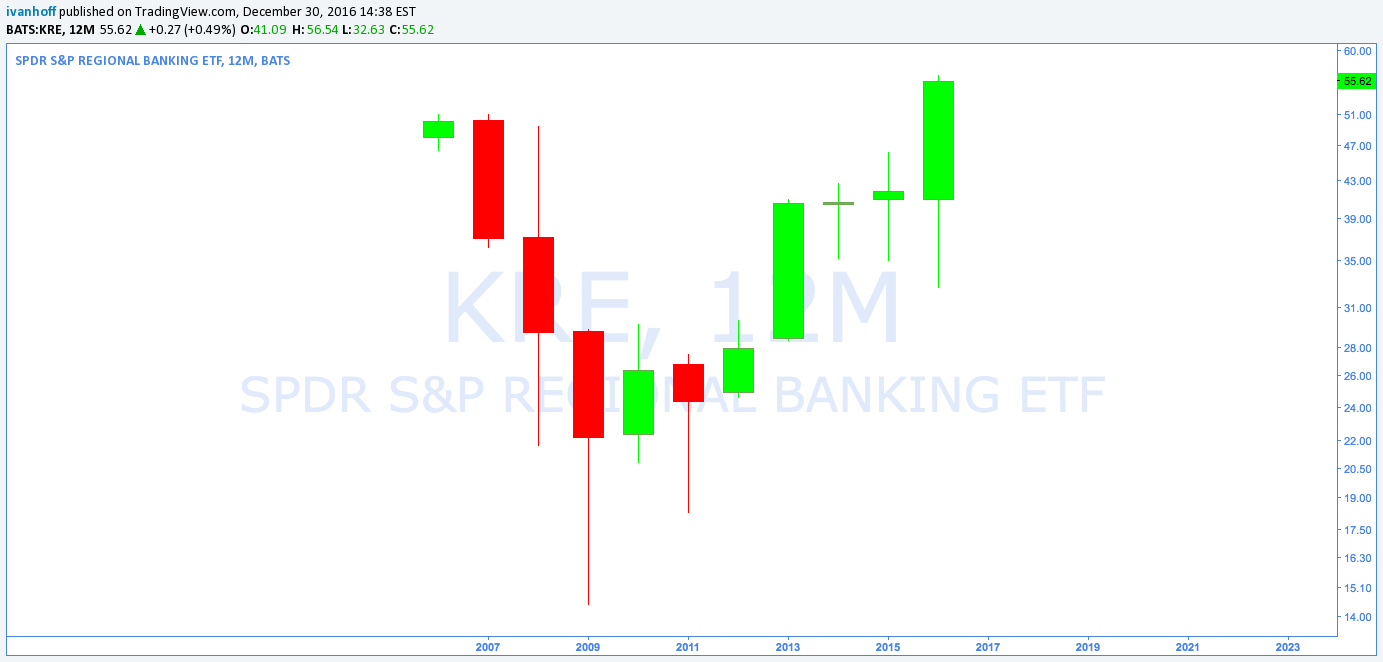
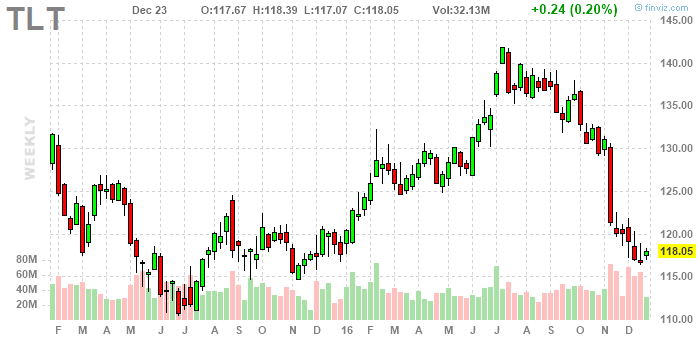
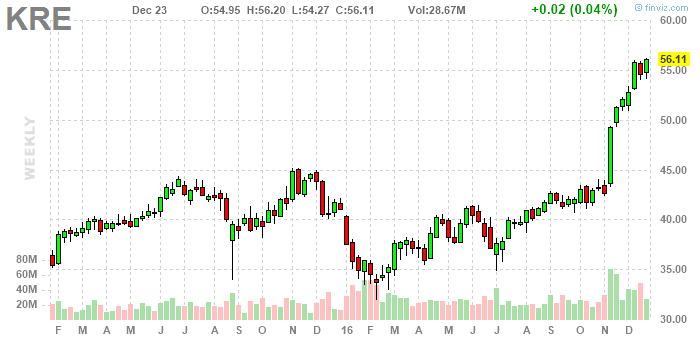
Donald Trump wins the U.S. presidential elections. The stock market goes limit down the night of the elections. Then, it stages one of the most massive short-term rallies in its recent history. Interest rates skyrocket. Financials break out and don’t look back.
I published my newest book in November: Top 10 Trading Setups – How to find them, When to trade them, How to make money with them.
December
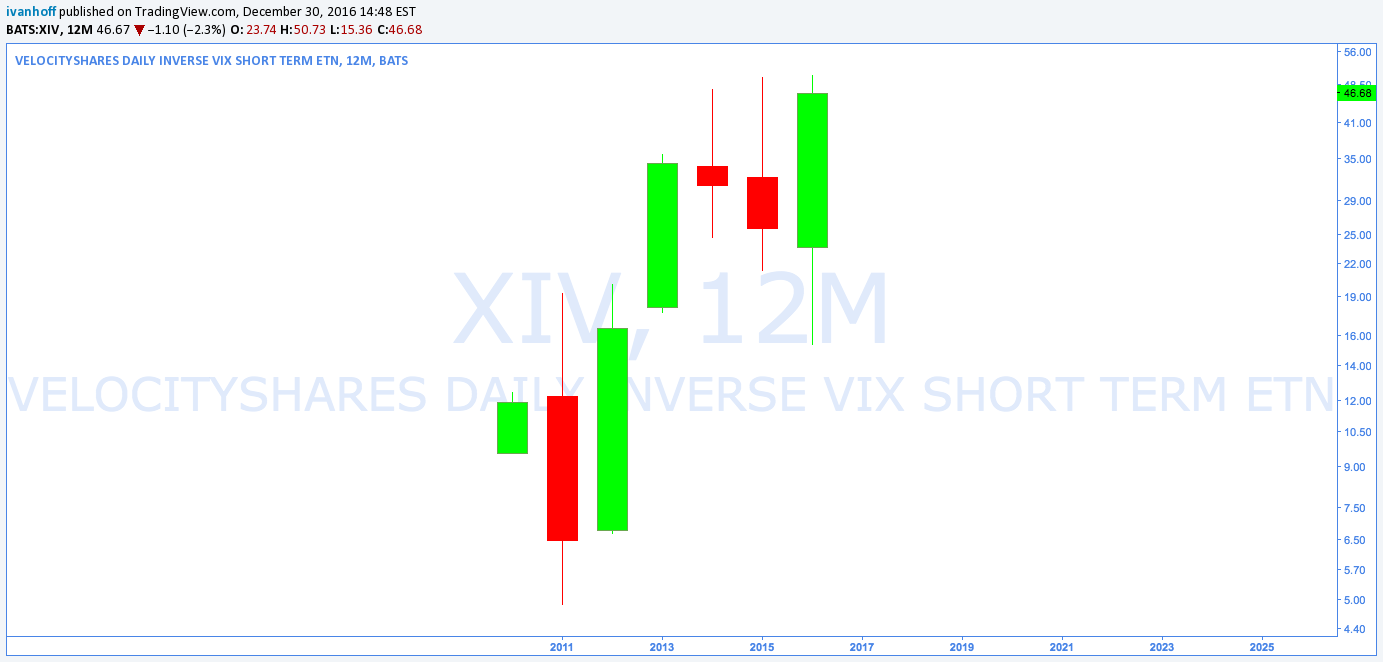
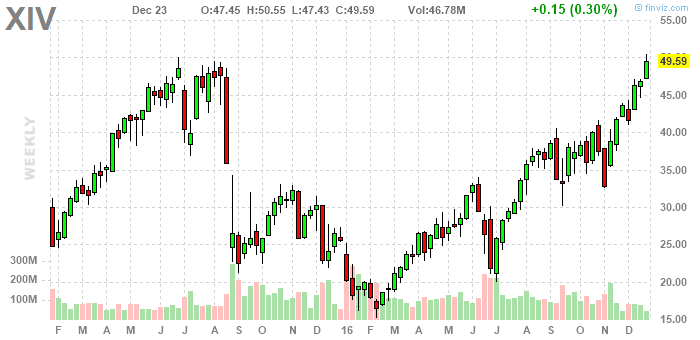
New lows in volatility. The inverse volatility ETF, XIV triples from its lows in February, 2016.
Sign up for our free weekly email at Market Wisdom. It is packed with actionable info and insightful market wisdom.