Why Earnings' Surprises Matter

One of the most powerful combinations that cause rapid price appreciation consist of neglected stock, low float, big upside surprise and favorable market conditions. Let’s dissect each of these elements by looking through the lenses of $BTH case:

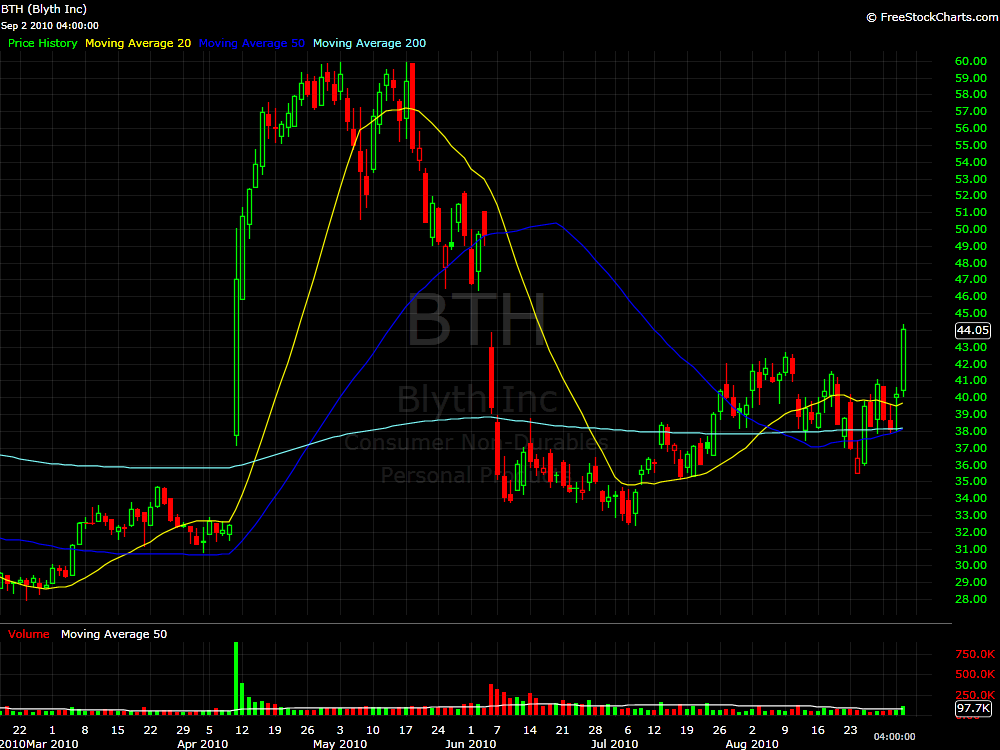
Between April 9th and 15th, $BTH went up from $32 to $57. (80% appreciation in 5 trading days). The reason:

1) Huge upside surprise: on April 9th, the company reported quarterly EPS of $2.59 vs estimates of $2.00 and same quarter, last year EPS of $1.42. Blyth Inc. also guided FY11 earnings at $3.20-3.50 vs consensus estimate of $2.50.

2) Neglect: tiny float of only 5.8m shares. When a catalyst causes an increase in demand for $BTH shares, there is simply not enough supply of them, which naturally results in rapid price move. Other signs of neglect are low ATR and low daily volume. Many are reluctant to look at stocks with average daily volume of under 50k. The truth is that after the appearance of a big catalyst, the price range expands and with it comes the liquidity. If there is a real growth story behind the range expansion, liquidity remains robust and even increases afterwards.

3) In the beginning of April capital markets were still under the influence of relatively high risk appetite. When sentiment is positive, all news is good news and market reaction tends to be favorable.

4) This was the first major positive earnings’ surprise for $BTH after series of consecutive misses.

Only two months after this spectacular 1 week run, $BTH gave back all its gains. The reasons – market went into capital preservation mode in mid May and on top of that $BTH guided lower at the beginning of June.

On Thursday morning I mentioned on StockTwits that I will be paying special attention to $BTH as the company guided higher again and it was close to breaking out from a 2 month range. I noted the 9 days of short interest that could fuel a potential short squeeze. It wasn’t the perfect scenario as the stock was far from its 6 month high, but in the same time risk appetite was gradually turning back into the market. (I prefer to enter stocks that are gapping at new multi-year high as a result of an earnings related catalyst). I don’t expect the stock to repeat its April move – the surprise is not as surprising as it was in April (I hope this makes sense) and sentiment is not at the same level. Nevertheless, $BTH is a typical example of 1-3 days opportunities that earnings’ breakouts bring every quarter.
Sectors' Relative Strength

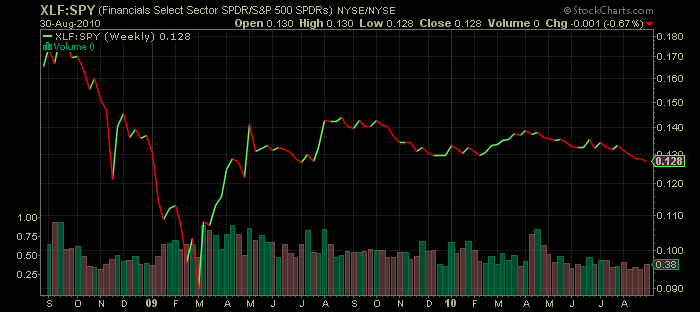
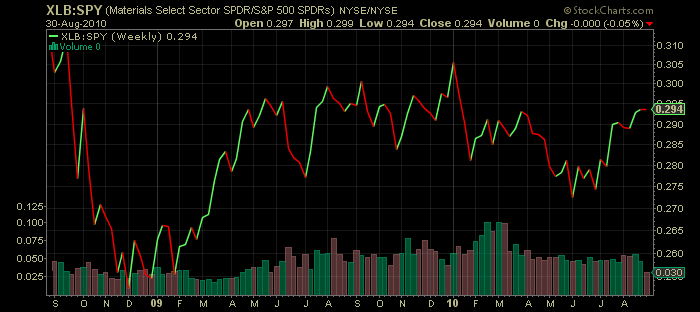
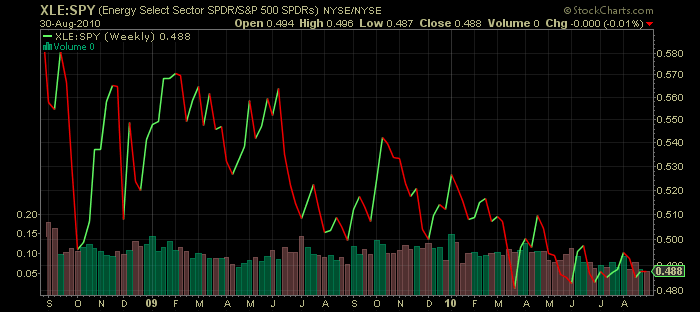
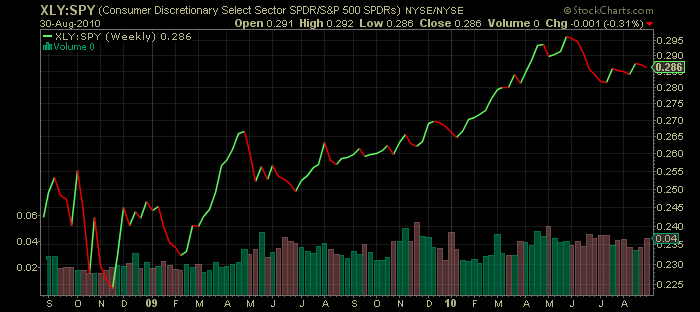
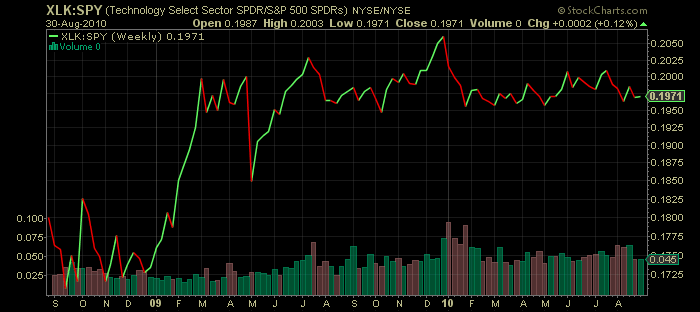
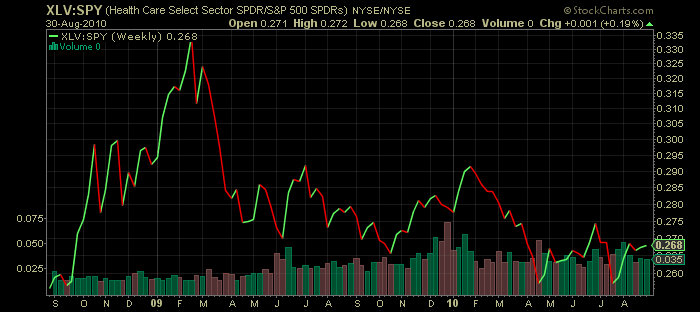
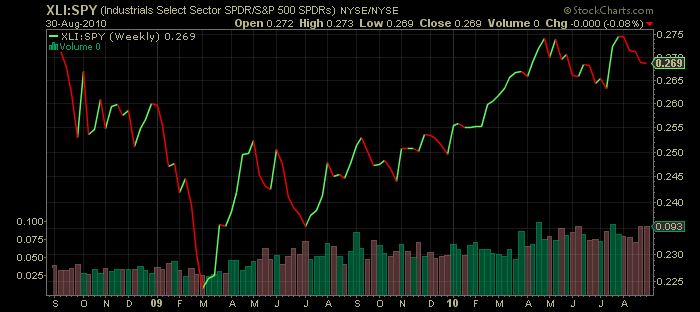
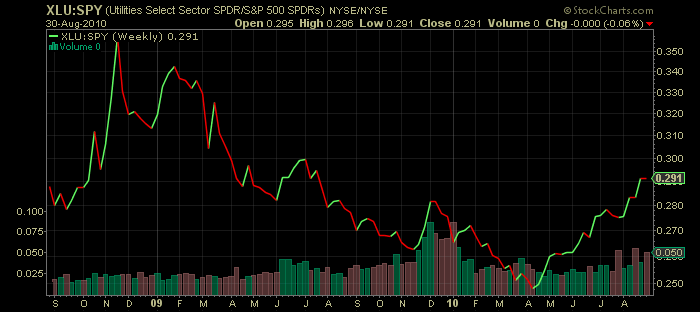
A look at sectors’ RS reveals a lot about the current market sentiment. In the following charts I am comparing each of S&P 500 main components to SPY itself. When the featured sector is outperforming the broad index, the line is rising.

When the market is in defensive mood, utility companies tend to outperform. Due to the nature of their high leverage, utility stocks tend to benefit during periods of declining interest rates’ expectations.

It pays to highlight that since end of July 2010 $XLF has been underperforming the broad index and leading the way down.

Despite the long bond ($TLT) and Japanese Yen ($FXY) making new 52 week highs on a weekly basis, the material sector (led by gold, silver miners and fertilizer companies) has been outperforming the SPY since mid June.

Market Reaction

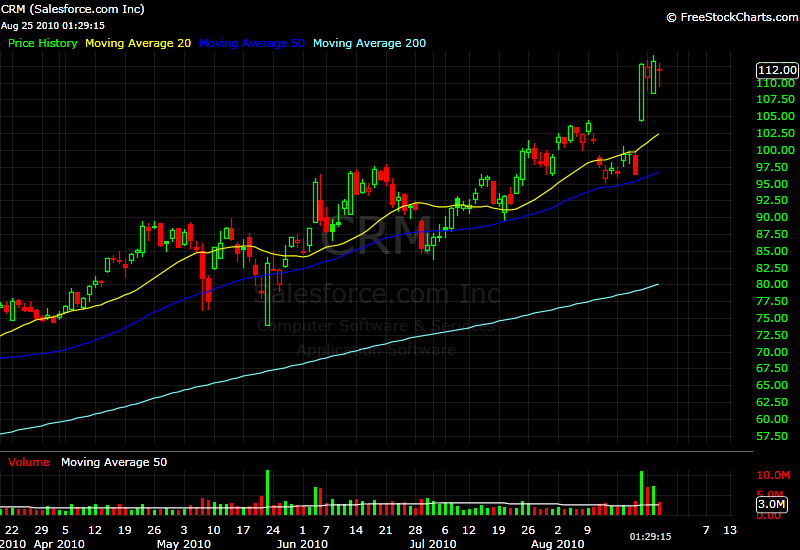
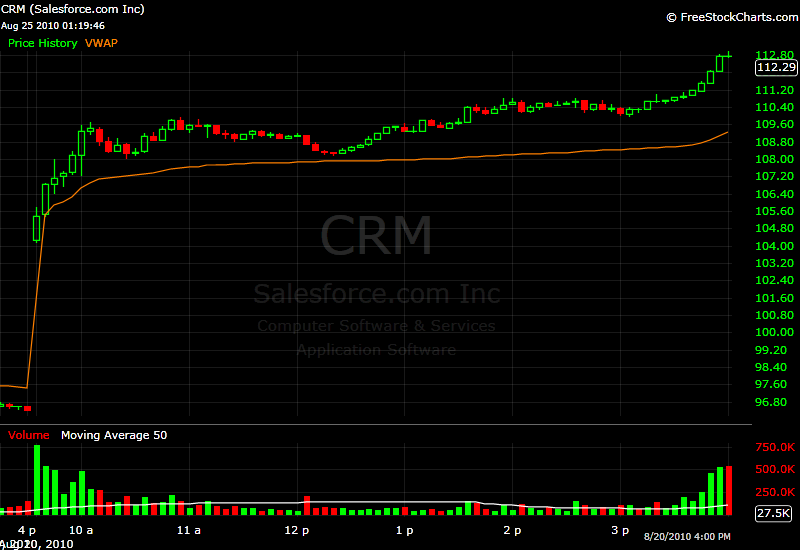
I have talked many times here that strong price moves are supported by a sequence of catalysts that change market participants’ perception of value and attract new buying interest. The initial market reaction to a catalyst tells a lot about the future price action in a stock. Let’s take a closer look at a typical setup I am looking for every day:

1) There is a strong catalyst (in this case, earnings’ guidance above the consensus estimate)

2) The stock opens close to a new 6 month high (multi-year high is preferable)

3) Short interest ratio is decent  (5.5 days in the case of $CRM)

4) There is an initial surge in price on very high volume

5) Consolidations are on low volume above the daily vwap

6) There is a second surge later in the day, allowing the stock to closes at the highs of its daily range.

It pays to be underlined that this setup will not work every time. There is no setup or pattern or check list that always works. The success rate is cyclical. This is why risk management is so essential. It takes you out at a minor cost from a trade that didn’t work out as expected. Recent example for me was $FMCN, which I mentioned on the StockTwits stream yesterday. The stock had high short interest ratio and at some point broke out to new 52 week high, only to reverse later in the day. My unrealized profits evaporated and I had to exit at a minor loss. Losses are natural part of the game; therefore they should not be taken personally.

From a 10,000 foot view ,in order to be a consistently profitable market participant, all you need to do is to find one good setup a day ( or a week or a month – depending on your trading/investing horizon).

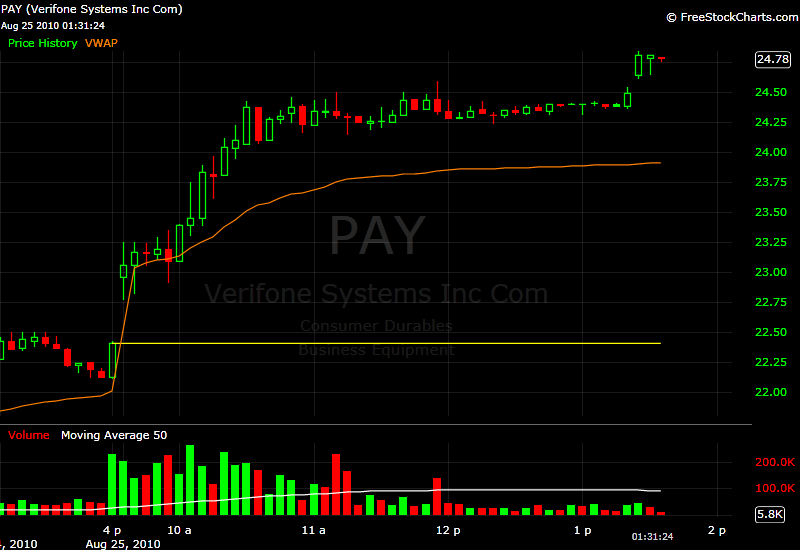
When there is a fresh catalyst, the overall market weakness is irrelevant for the day. The most recent example is $PAY. About half an hour before market open, I mentioned on StockTwits:

ivanhoff $PAY beat and raised guidance. Close to 52week high; 10d short interest; neutral mkt reaction so far. I will keep an eye on it. Aug. 25 at 7:51 AM