Here are six charts that defined price action and investors’ psychology in 2016.
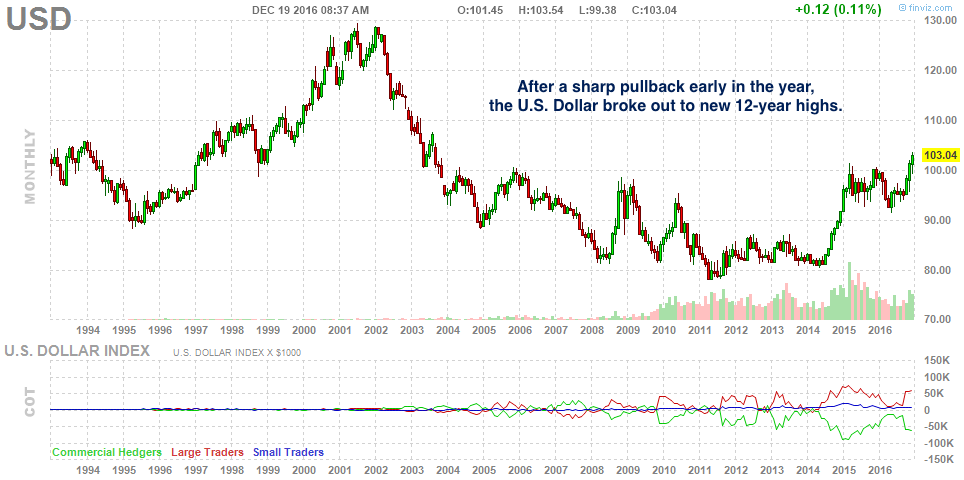
1. The U.S. dollar added to his gains from last year. This has helped small caps to outperform. It would be interesting to see of any of the large-cap multinationals starts complaining about the Dollar’s impact on their margins.
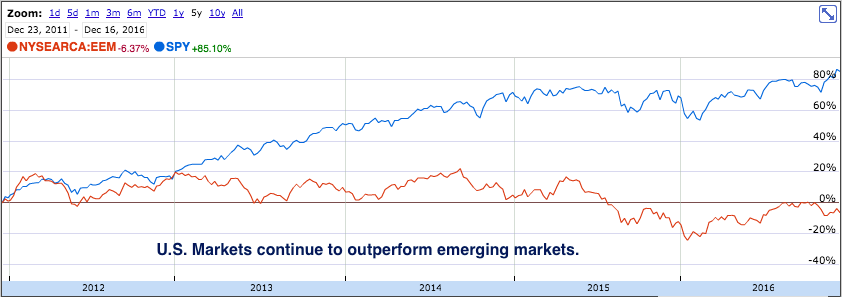
2. Emerging markets continue to underperform. The strong dollar is the main reason.
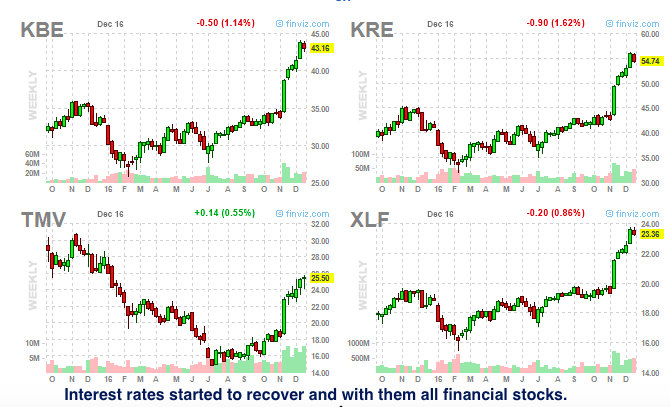
3. The spike in interest rates has been a boon for financials.
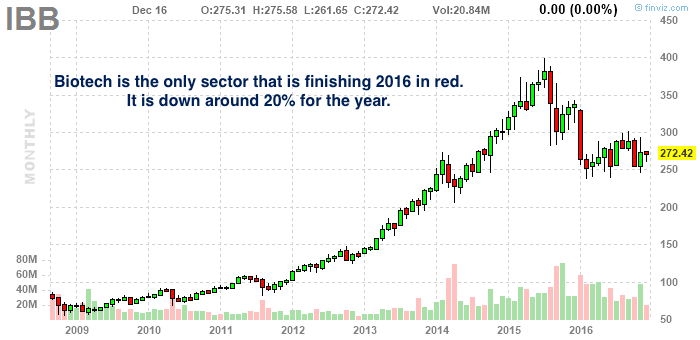
4. The biotech sector has been naughty in 2016. Most momentum stocks tend to give back 50% to 80% of their upside move after they break down. IBB is down about 33% from its all-time highs. Biotech has always been a sector of stocks with relatively low correlation among them.
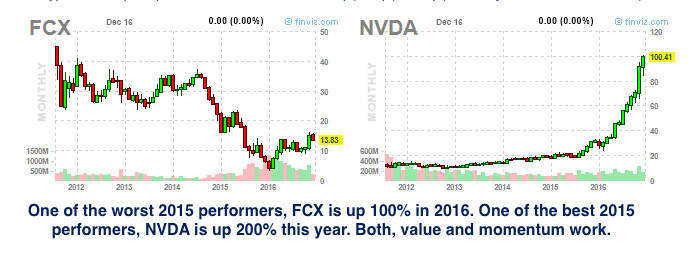
5. Both, value and momentum can work.
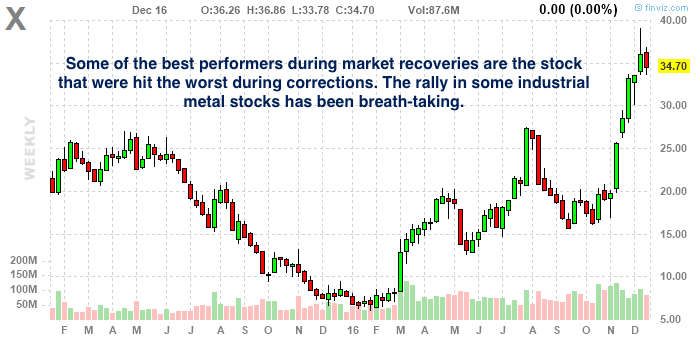
6. The best performers after a deep market correction are usually the stocks that were hit the worst during that correction.
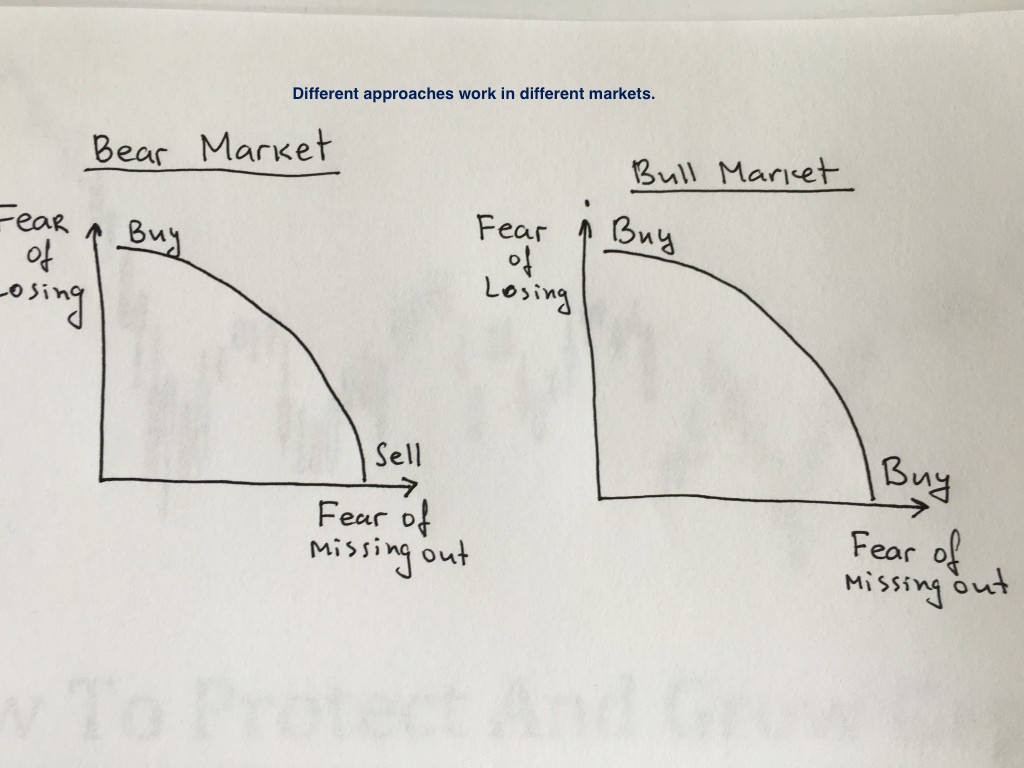
7. Bonus graph
Check out my newest book: Top 10 Trading Setups – How to find them, when to trade them, how to make money with them.