Liquidity Follows Price

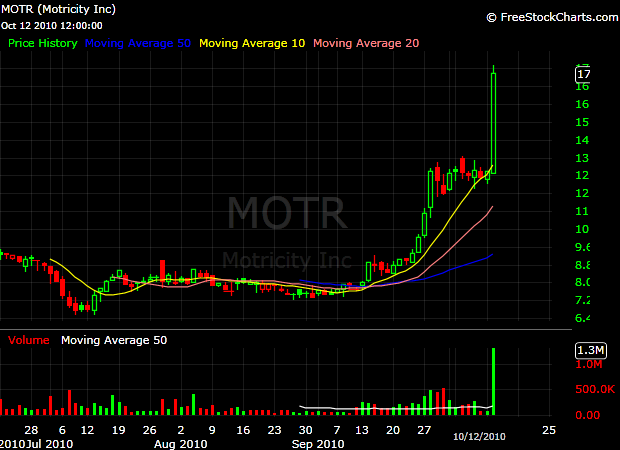
Today one of the suggested traders on StockTwits@johnsontrading made a very good comment on the price/volume action in $MOTR:

$MOTR – it can pay to not be too strict with volume criteria as often vol shows up when you need it – 61k shares trade yest and 820k today, Oct. 12 at 2:45 PM

Most of us are applying a minimum average daily volume filter in our screens and are missing on some the most furious, short-term moves. When we created StockTwits 50, liquidity was an important criteria and it still is. The reasoning beside that decision is very simple – low liquidity creates higher volatility, it makes accumulation difficult and flawless exits close to impossible. In the same time, we understand the impact that a new catalyst could cause to a stock’s average daily traded volume and this is reflected in the ST50 algorithm.

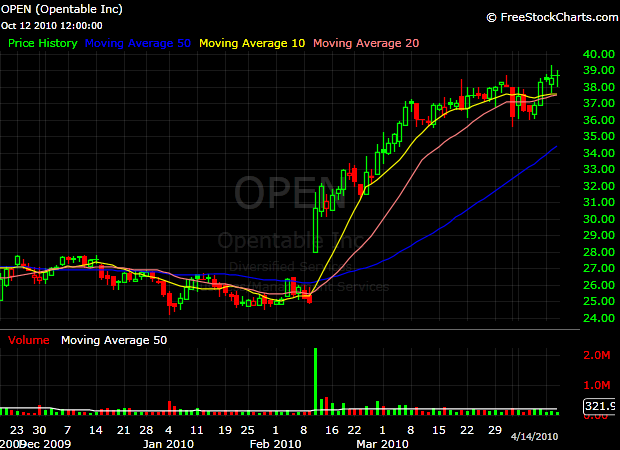
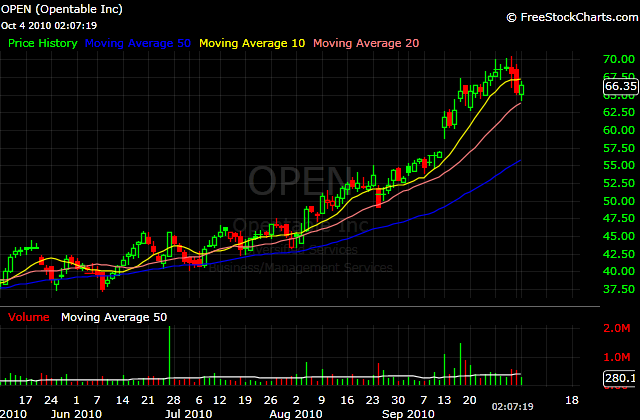
Let’s go back in time and take a look at the price/volume action in $OPEN. On February 9th, Open Table Inc. reported a quarterly EPS of $0.14 vs consensus estimate of $0.07. The Y/Y revenue growth was 32%.

Before the report, the average daily volume in $OPEN was about 100k

A month after the report, the averege volume increased to 200k

Today, 9 months later, the average daily volume is 400k

Liquidity tends to follow price, when there is a sustainable catalyst behind the move.

The Proper Use of Moving Averages

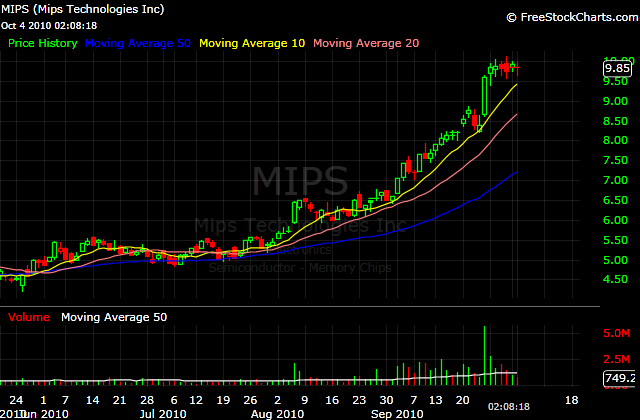
Every stock has its own character. Some tend to keep their 5 day MA during the bigger part of their uptrend, others tend to keep their rising 10, 20 or 50 day MAs. The shorter the MA, the stronger the demand for the underlying stock.

There is nothing magical about the major moving averages. If they worked a few times as a support in the recent past, a large number of market participants start to believe that those same levels will work again. When enough people act on their beliefs, their expectations turn into self fulfilling prophecies and the stock bounces again from the same moving average.

Why such declines and bounces occur? Many market participants are reluctant to buy new highs or stocks that are extended from their bases. The next logical buy point is a bounce from a major moving average. Remark that I mentioned a Bounce. Today I noticed many people on the StockTwits stream to blindly buy stocks that were close to their 20 and 50-day SMAs. Everyone has his own approach. I just think that this one hides too many underwater rocks. Those MAs are a potential zone of support, not a sure thing.

Institutions and market makers are well aware of the fact that many market participants tend to put their stop losses right below the 5,10, 20 or 50-day MAs of the stocks they own. This is why, it is not rare to see a stock to dip intraday below a major MA. Such dip shakes the weak hands off and the stock resumes higher. I am also using the major MAs as a stop, but I added a few extra conditions:

– the stock closes below a major MA that has played the role of support during the recent uptrend;

– an exit signal is given, when the stock penetrates the low of the day on which the stock closed below the relevant MA.

What is the logic behind this exit approach? A close below a major MA doesn’t signify the end of a trend. It just signals change in the pace of growth and the potential beginning of the new base. Exiting at the above mentioned signal makes sure that your capital is not locked in stocks that will move in a range for a while. With other words, you make sure that your capital is allocated to positions that move in the desired direction and move fast.

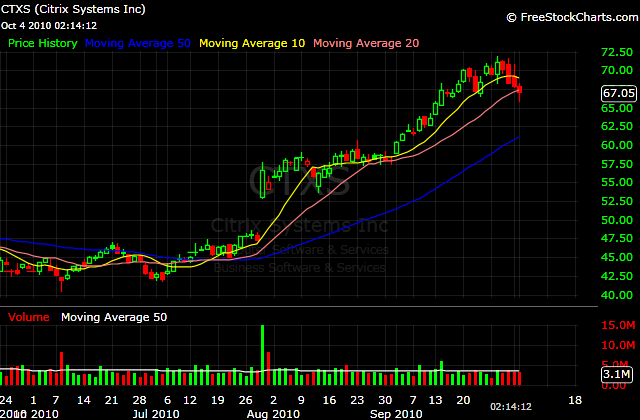
Last week, I mentioned that I am eying one of the StockTwits 50 stocks – $CTXS, to pullback to its rising 20 day MA before I consider entering it. I would never buy a stock just because it has declined to its rising 5, 10, 20 or 50 day SMA. I always wait first for a 3% bounce on above the average volume, before I commit any capital.