Big Returns Need Big Corrections

In October 2008, Warren Buffett wrote an op-ed in New York Times titled “Buy American. I Am”. When volatility and correlations were at record high levels, when most investors were running scared and could not sell their stocks fast enough, Buffett was buying with both hands.

Five years later, the S & P 500 has more than doubled. More interestingly, there are 115 stocks that have gone up more than 1000% in the same time. The big winners come from various industries: biotech, media, furniture stores, a Chinese search engine, an yoga apparel store, an online travel agency, pizza restaurants, regional banks, casinos, hotels and many others. Many of them were priced for bankruptcy, which never materialized. You did not have to guess which ones were going go survive. You could have made a ton of money by entering in the middle of their trends, when their existence was not questionable and when they were making new 52-week highs every month.

Every time I mention the best performing stocks over a certain period of time, there is always someone to criticize me – “Don’t tell me what happened. Tell me what will happen next. Tell me the next stocks that will go up over 1000% in the next 5 years”.

I don’t have a crystal ball. I don’t know. No one does.

What I know is that big corrections put the foundations for big future moves. Bear markets make investors a lot of money. Most of them just don’t know it at the time.

What I know is that many of the best future performers are likely to make new 52-week highs well ahead of the market averages.

What I know is that strong stocks leave traces, so you could participate in part of their trends. Take the best performing stock of the past 5 years for example. Pharmacyclics ($PCYC) went up more than 110 times in the last half decade. It more than doubled in each of the past three years. It hit new all-time highs multiple times. You did not need a time machine to notice this trend, but you needed some basic trend following rules in order to stay with this trend long enough to make a difference in your returns.

Where Is The Froth?

This morning, I saw someone tweeting an interesting observation by legendary investor Peter Lynch:

“Far more money has been lost by investors preparing for corrections or trying to anticipate corrections than in corrections themselves”.

It is a really good reference to many investors’ natural bias to constantly look for some form of mean-reversion in the midst of strong trends. Blind contrarians are a good thing for trends. Every trend needs doubters and skeptics – otherwise there won’t be anyone left to buy.

The last quarter of each positive year is often marked  by performance chasing by under-invested money managers. So far in Q4, most of the momentum leaders from the first 3 quarters have not only not outperformed, but have experienced sizable corrections. The best performers since October have been breakouts from several months long ranges. I don’t know about you, but I cannot call this a froth. The market has been very level-headed and it has constantly corrected through sector rotations and pullbacks to major moving averages. The fear of missing out has not been that much bigger than the fear of losing.

It is true that at this particular time, the indexes are a bit technically extended and overbought. It won’t be a surprise to see some form of consolidation through time (sideways) or space (price decline) in the near-term perspective. It might have already started on Friday afternoon – nothing to fret about. It is still a bull market of stocks, where dips are likely to be welcomed as buying opportunities.

logo_dark

Is Studying What Hedge Funds Bought Last Quarter Helpful?

There is a whole industry dedicated to studying hedge funds’ past purchases in an attempt to extract some alpha. Once a quarter, all institutional investors with over $100mm under management are required to report their long positions –  the so called Form 13F is filed within 45 days of the end of a calendar quarter. Basically, 13F is a look at what hedge funds bought and sold 45 days or more ago.

This morning, I was going through Josh Brown’s links and clicked on a piece from FactSet, covering hedge funds’ moves from Q3. I saw that the two largest individual stock additions in that quarter were Facebook ($FB) and Baidu ($BIDU) and tweeted the following:

ivanhoff

Nov. 22 at 9:28 AM

Reading about what hedge funds bought last quarter has mainly educational value. Price actions tells you what they do in real time.

We certainly did not need to wait a few months to figure out that $FB and $BIDU were under heavy accumulation during the summer.  Price action on those names told use everything we had to know, in real time.

Don’t get me wrong – there are many strategies that try to piggy-back some of the famous money managers positions. Some are doing an exceptional job by copying and following. From my perspective, 13Fs have more educational than actionable value. 13Fs could help you figure out how investors think and when they buy and sell. In the case of $FB and $BIDU in Q3, there are three main observations that could be made:

1) Buying highly shorted stocks after they crush earnings estimates and gap to new all-time highs.

2) Pay attention to industry relative strength – anything related to social media and internet was melting hot during the summer.

3) When institutions buy, they leave traces. They don’t do all their buying in one day, therefore there’s plenty of time for anyone who is watchful enough to jump back with them in real time.

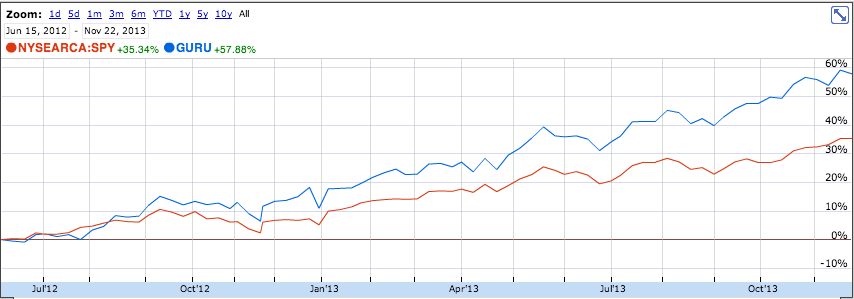
A minute after my tweet, my friend Frank Zorrilla (@zortrades) reminded me that there’s an ETF ($GURU) that buys what select hedge funds bought last quarter and it has been delivering some solid alpha since inception. Look at the chart below

Screen Shot 2013-11-22 at 7.57.13 AM

How is that outperformance possible when the media has constantly bombarded us with proves that cumulatively, hedge funds have not really generated any alpha after fees over the past decade? How is it possible for an ETF that buys weeks and months after the tracked hedge funds bought, to outperform the S&P 500. I have no idea what the actual performance of the tracked hedge funds is, but here’s why this ETF might have done so well lately.

1) it tracks mainly hedge funds, which average holding period is more than a year

2) it charges relatively smaller fee of 75bps. Hedge funds charge 2% and 20%. This is a huge difference. If a hedge fund makes 40% pre-fees, after 2/20 its return will be a little less than 30%.

Take into account that this ETF is relatively young and has only operated in a scorching hot bull market. Typically, the success rate of all market strategies is cyclical.