This Is How You Win A Bet

chart

We are wired to assume that the future will be like the near-term past and underestimate the potential for a major change. As Howard Marks would say “99% of financial history has taken place inside two standard deviations, but everything interesting has taken place outside those bounds”. Indeed.

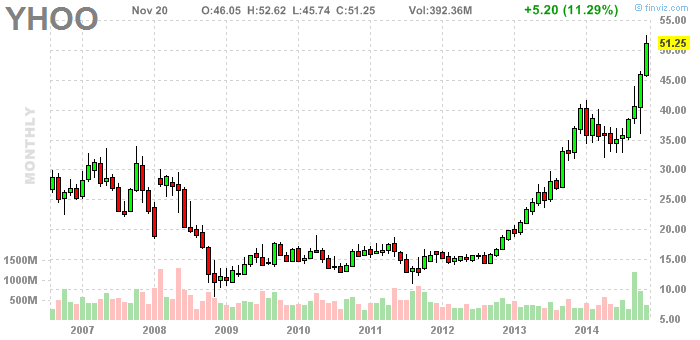
A little more than 3 years ago, Yahoo was still trading under $15 and was considered one of the dogs on Wall Street. It had changed 6 different CEOs inside a few short years and it had done very little for its investors. Back in those time, Phil Pearlman went on a limb and called that Yahoo could be a $50-billion dollar company in 3 years. I decided to make a friendly bet with him and told him that if it happens, I will send him a case of premium beer.

I felt quite confident in my position. It was like selling very out of the money call spread for a very decent premium: risk/reward was 1:1 and I did to be a good sport, too.

Earlier this week, Yahoo came within very close proximity of reaching Phil’s target. I consider it good enough to admit that he is the winner of our bet.

Here’s the brain behind this call. His StockTwits and Twitter handle is @ppearlman

p

The curious thing about $YHOO is that none of us needed to have some special insights in order to make money in it. Price was all we needed to spot a major change of trend. In November 2012, $YHOO cleared new multi-year highs from a very long sideways base near $16 and it hasn’t looked back ever since. We made that bet before the breakout occurred.

I don’t know what his reasoning was and how his thinking changed over time, but I have to admit that he made an incredible call and he won his beer fair and square.

Cheers, Phil
14578067895_56245d09a4_z

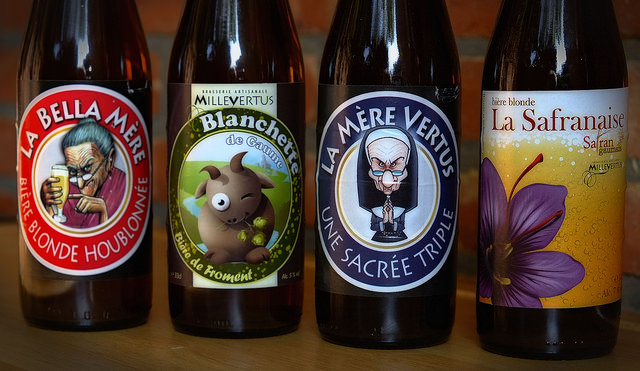
Beer photo credit: Eric Huybrechts
Quick Look At Market Breadth

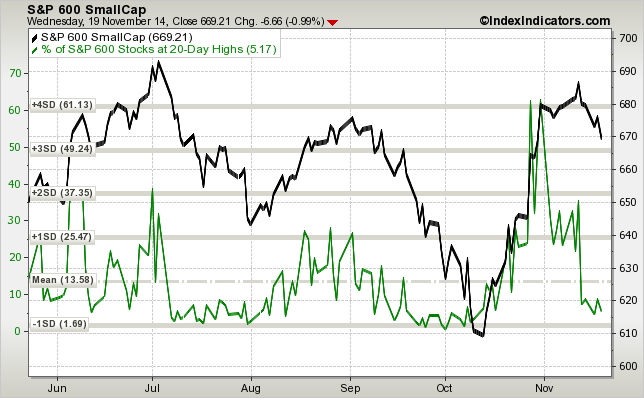
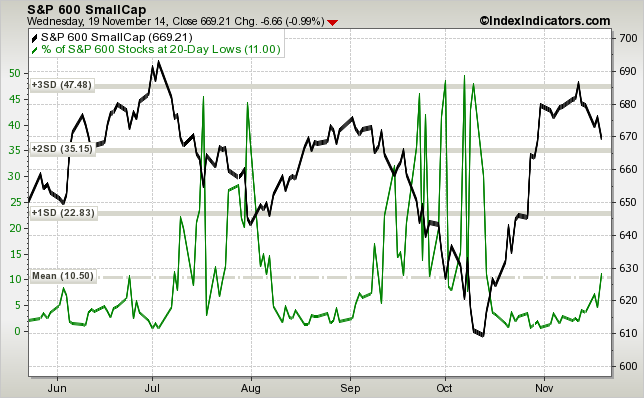
The breadth in small caps continues to deteriorate. Not only are new 20-day lows back below 10%, but new 20-day lows are picking up too, which is an indication of increasing selling pressure:

sp600-vs-sp600-stocks-at-20d-highs-params-6m-x-x-x

sp600-vs-sp600-stocks-at-20d-lows-params-6m-x-x-x

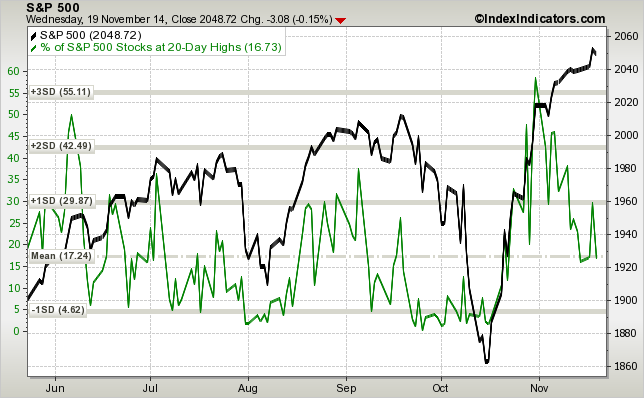
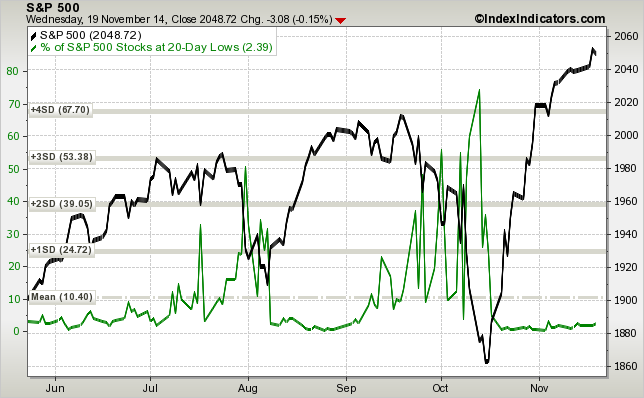
The situation in large caps is different – $SPY has been making new all-time highs on a smaller and smaller number of stocks making new 20-day highs. This is not too unusual after a bounce from a significant pullback. Typically, correlations are very high during the initial stages of a recovery – most stocks bottom together and move higher together. The next stage of a recovery is a market of stocks environment, where stocks start to trade on their individual merits. The big difference in large caps is that the number of new 20-day lows has flatlined. Overall, it means that while people are not too excited about chasing at these levels, they are also reluctant to sell large caps, for now.

sp500-vs-sp500-stocks-at-20d-highs-params-6m-x-x-x

sp500-vs-sp500-stocks-at-20d-lows-params-6m-x-x-x

One could make the argument that small caps and momentum stocks in general typically lead on the way down and on the way up, but as we have seen over the past couple years – divergencies could continue for quite some time. Bull markets often correct through sector rotation, where leadership changes every few months.

Check my new book: The 5 Secrets To Highly Profitable Swing Trading

10,000 Foot View

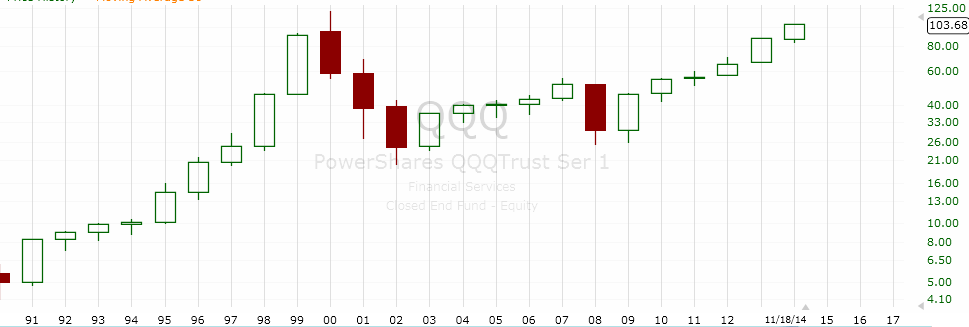
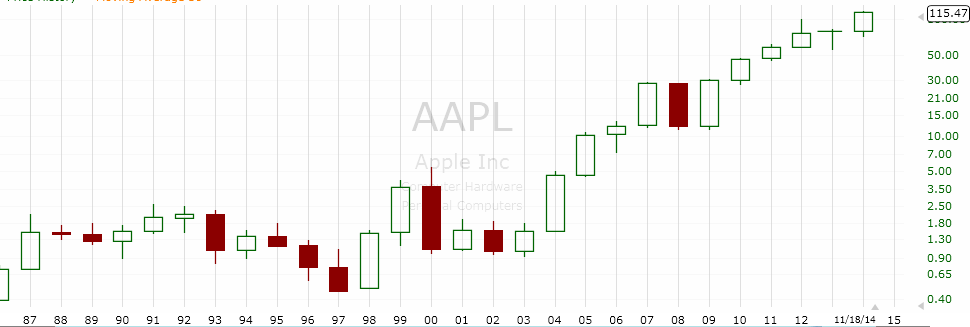
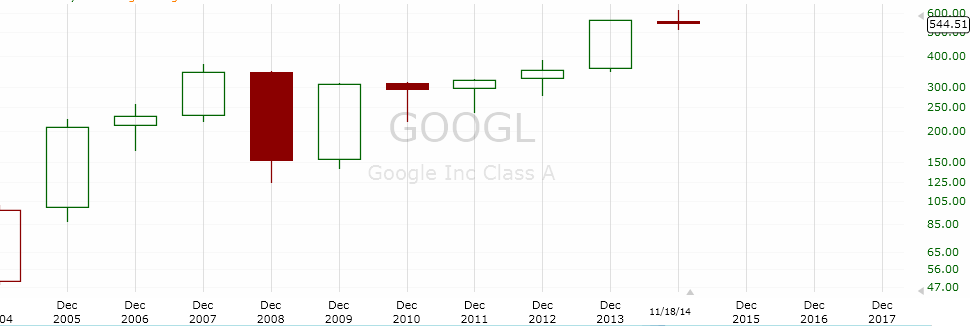
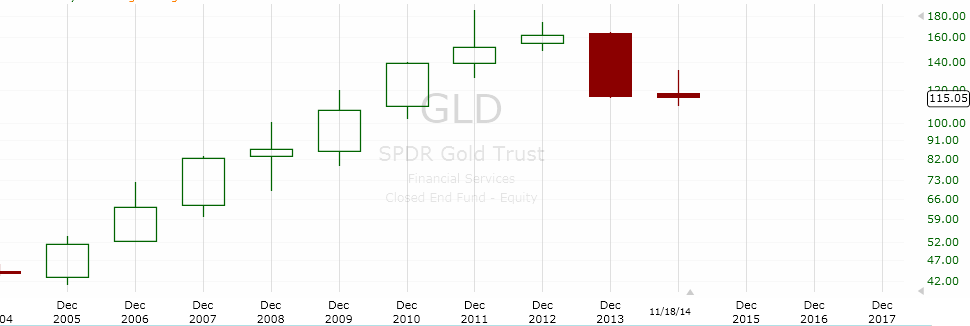
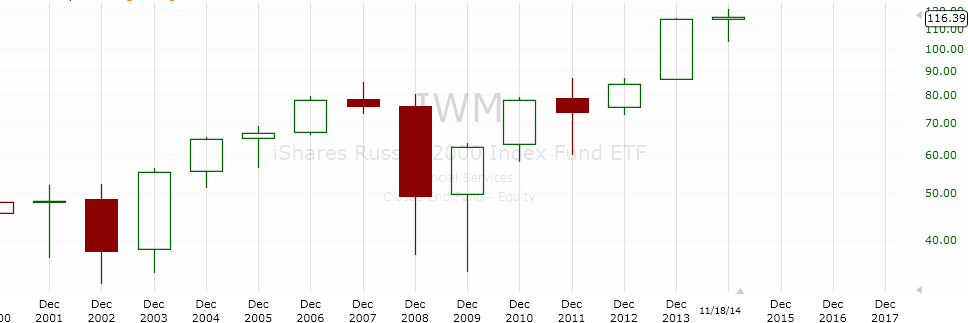
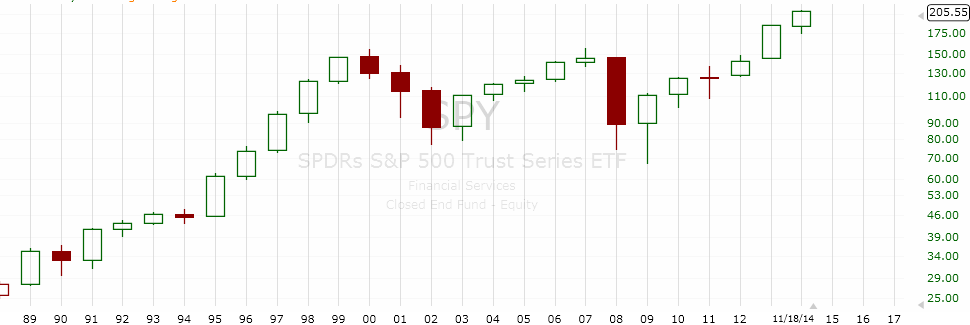
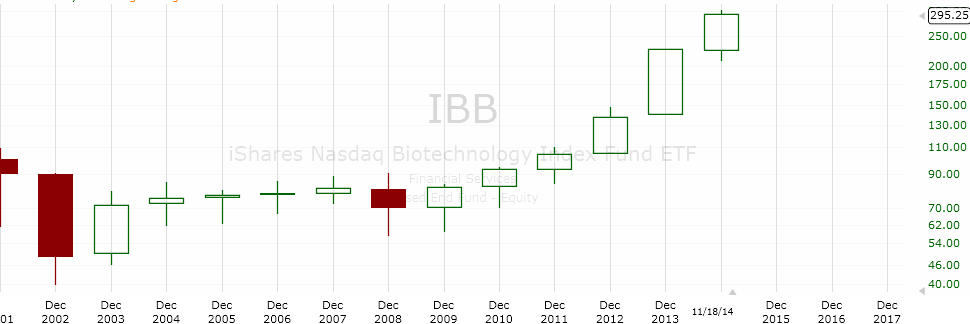
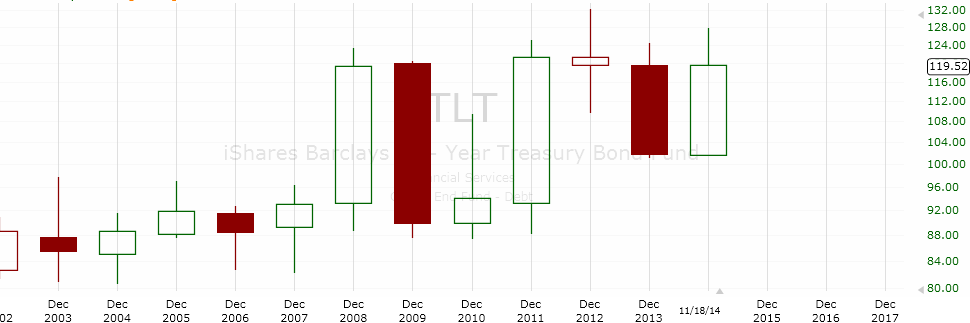
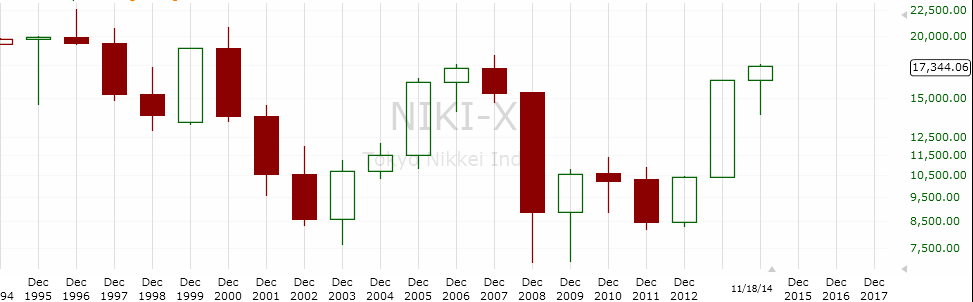
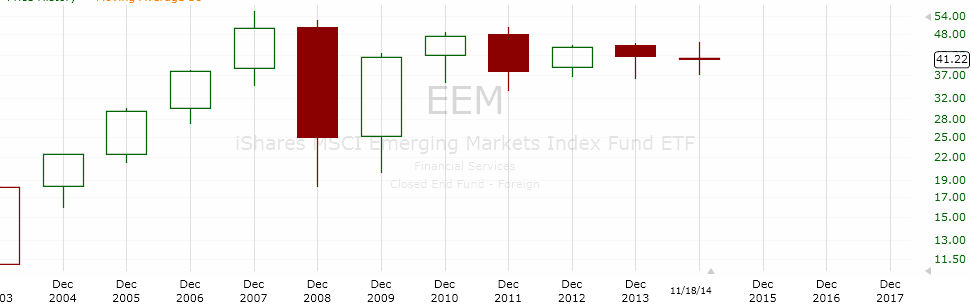
I bet you don’t look very often at charts, where one candle represents one year. Neither do I. Sometimes, it is interesting to take a step back and look at the big picture. Here are the annual charts of some of the major stock indexes, sectors and equities:

Screen Shot 2014-11-19 at 5.06.49 AM

Screen Shot 2014-11-19 at 5.07.31 AM

Screen Shot 2014-11-19 at 5.08.04 AM

Screen Shot 2014-11-19 at 5.08.44 AM

Screen Shot 2014-11-19 at 5.10.05 AM

Screen Shot 2014-11-19 at 5.10.28 AM

Screen Shot 2014-11-19 at 5.11.21 AM

Screen Shot 2014-11-19 at 5.11.49 AM

Screen Shot 2014-11-19 at 5.13.29 AM

Screen Shot 2014-11-19 at 5.13.58 AM