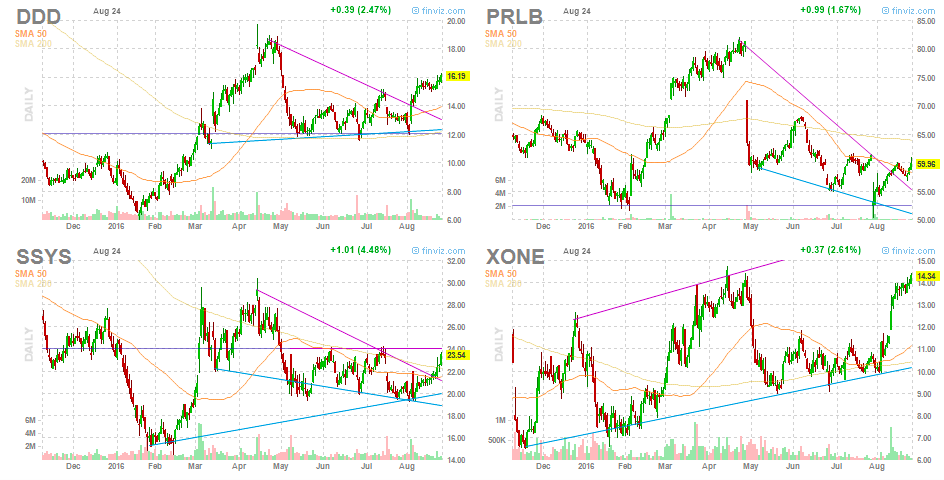
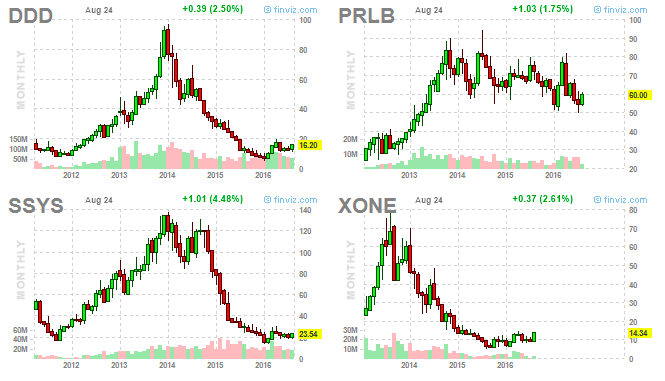
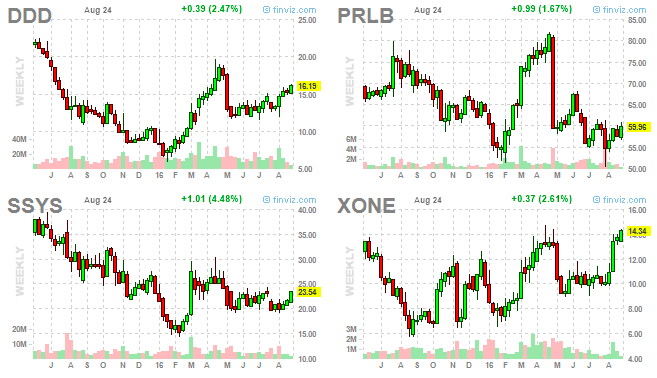
3D Printing Stocks – Up 1000% in 3 years, then Down 90% in 2 years, Now What?

The so-called story stocks often give up 50% to 90% of their upside moves. This happened to 3D printing stocks in the past couple of years after their earnings and sales numbers didn’t live up to market’s heightened expectations.

m

2016 has been the year of comebacks. Many highly-shorted stocks that in January were trading 80% to 90% below their all-time high prices, staged impressive comebacks. 3D printing stocks belong that group.

2

What’s interesting is that their most recent earnings reports came in far below expectations. After a few weeks of violent volatility, they managed to swipe the bad news under the rug and move higher. Such price behavior can only be seen in a bull market.

d

Cherry Picking Investing Periods

By cherry-picking investing periods, we could prove any thesis. You could make the black – white and the white – black. Michael Batnick has an interesting take on the subject.

From 1970-today, Japanese stocks grew 9.1% a year. But from 1990-today, Japanese stocks lost -0.2% a year.

The reason why the numbers are so different when you change the goalposts is because from 1970-1989, Japanese stocks rocketed 6067%, and then fell 60% from the end of 1989 through the spring of 2003.

From 1929-today, U.S. stocks grew 9.4% a year. But from 1932-today, U.S. stocks returned 11% a year.

The reason why the numbers are so different when you change the goalposts is because U.S. stocks fell 90% during the Great Depression.

When looking at returns, be sure that the start date begins at inception and ends at the most recent period. If it doesn’t, make sure to find out why because cherry picking dates is the red flag of all red flags. By massaging the numbers, you can get the truth to tell any lie you want. This is what Benjamin Disraeli had in mind when he said “There are three kinds of lies: lies, damned lies, and statistics.”

“When looking at returns, be sure the start date begins at inception and ends at the most recent period”. I understand Michael’s logic. I don’t agree with his conclusion for two main reasons:

1. It is hard to pin-point the inception for an asset class. What should be the inception point for houses? 1950, 1900, 2000BC? What should be the inception point for U.S. stocks? 1890, 1920, 1945? The further we go back in time, the less reliable data is and harder the comparision, because conditions have changed substantially.

2. Most people have a limited investing horizon. It is usually not 100 years, It is more like 30 or 40 years, if you start early. By showing returns from different periods, you reveal a better and more real picture – there are periods of high returns followed by periods of low returns; there are periods when almost everyone is making money by applying one approach, followed by periods when almost everyone is losing money by applying the same approach. You could show people the average 30-year rolling period return, but some people are not going to experience the average.
The Biggest Winners Are Usually A Pleasant Surprise

Peter Lynch has given the investment world a lot of market wisdom. Here is one of his most insightful thoughts:

The point is, there’s no arbitrary limit to how high a stock can go, and if the story is still good, the earnings continue to improve, and the fundamentals haven’t changed, “can’t go much higher” is a terrible reason to snub a stock. Shame on all those experts who advise clients to sell automatically after they double their money. You’ll never get a ten-bagger doing that.

Frankly, I’ve never been able to predict which stocks will go up tenfold, or which will go up fivefold. I try to stick with them as long as the story’s intact, hoping to be pleasantly surprised. The success of a company isn’t the surprise, but what the shares bring often is.

I am not a long-term investor like Peter Lynch. I am a swing and position trader and yet I agree with his statement. This is why I have never been a fan of hard price targets. I believe in having a time stop for swing trades – giving a stock a certain number of days to prove that it deserves to be held. I believe in having exit strategies in both, my swing and position trades. Those exit strategies are never based on a hard price level. They are based on price cycles and invalidation of trends on different time frames. My reasoning is simple:

  1. I don’t know which particular trade will end up being a winner. I know that I’ll be right at least 50% of the time and my average winner is bigger than my average loser.
  2. I don’t know what profit will a particular winner deliver. It could be 5% or 50%. I know the average size of my winners, but never what the individual return will be in advance.

Check out our 14-day free trial at Market Wisdom.