Fast moves

audiI am starting a new sequel of posts that will look at stocks that gained/lost more than 20% in a week. Was there something common among them, just before they started their move.

As of today’s close there are 61 stocks that gained more than 20% during the last 5 trading day. 37 of them were up more than 100% before they started their 20%+ move. It is true that we are experiencing an abnormal year, during which SPY is up 61% from its March’s lows, but the relative strength is a phenomenon that for the most part has always worked (stocks that outperformed during the last 6 months/1 year tend to outperform during the next 6 month/1year).

As of today’s close there are 3530 stocks that are priced above $1 and trade more than 100k share per day. 537 of them (or 15.2%) more than doubled during the last 6 months. As I mentioned already, out of the 61 stocks up 20%+ during the last week, 37 ( or 60.6%) have been already doubled before their last week’s move. One day is not statistically representative to declare that I have found a way to improve the odds of finding a fast moving stock. I have been following “the 20%+ in a week list” for a while and I can tell you that the stocks that had a 6 months gain of more than 100%+ before the fast  move, were consistently north of 50% of the list.

In other posts I will point out other common characteristics among the fast movers.

Some trading ideas from my momentum screen for the next several days:

RVI NTWK JAZZ ROIAK GTN IGOI CBI AHCI PCX

Best performing stocks YTD – part 2

lotus

The odds are that the future best performing stocks will be neglected for a long time before they start really moving. Neglected price-wise and volume-wise. Then they’ll experience a sudden price and volume expansion, fueled by a catalyst or many of them, one after another. Prices are moved by catalysts as they provide a reason for funds to accumulate certain stocks. Why do I care how funds’ managers think and act? Well, they control 80% of the market’s volume and have the ability to create trends. A remarkable liquidity expansion is a sign of institutional interest. Everyone knows the saying that it takes a crowd to attract bigger crowd. In the investing/trading world, it takes liquidity expansion to attract even more players, who will boost price and volume even further.

The essence of catalysts has always been about expectations for higher earnings in the future. Those expectations could be based on various reasons:

– better than expected EPS and sales’ growth;

– lifting guidance for next quarter (year);

– new contract or sequence of new contracts, which proceeds represent significant part of the company’s sales; (take a look at OSK, CRAY, STEC)

– legal changes that alter the business environment for the whole industry; (solar subsidies);

– FDA’s approval for certain drug or small bio-tech company enters into a multimillion agreement with a pharmaceutical giant.

– great earnings’ report by a member of the same industry group. It often leads to the so called “sympathy play”, where all members of that group are getting a lift. The reason behind it is very simple. Due to their size, funds need weeks and sometimes months to accumulate the desired number of shares of one company. Since they rarely could achieve that, they look at peer members of the same group. This is why we say that stocks tend to move in groups. Look at what happen in the Auto&Truck parts industry this year. 1/3 of its members more than doubled in value since January 09. Successful funds’ managers think in terms of major investing themes. They base their decision on the prospects for a whole industry group.

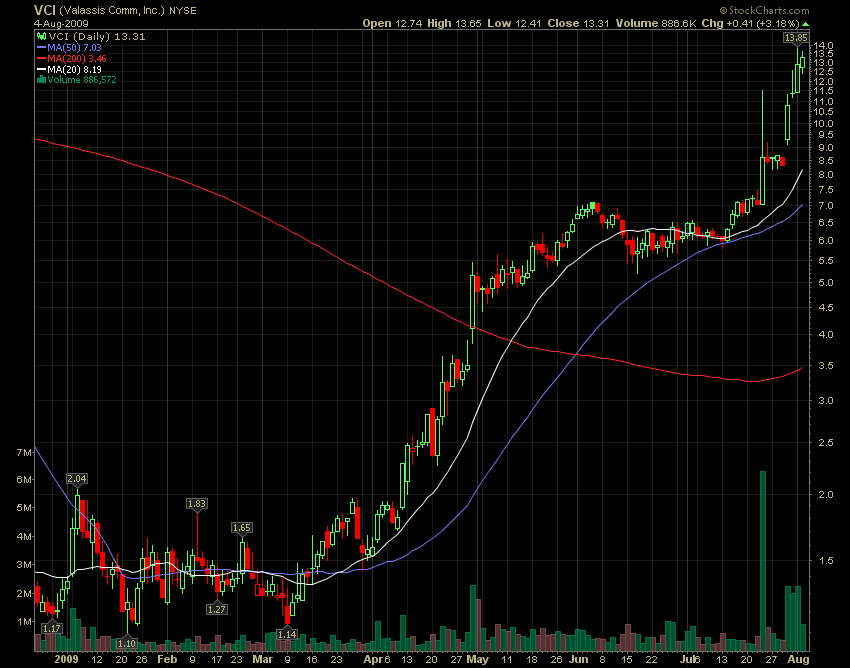
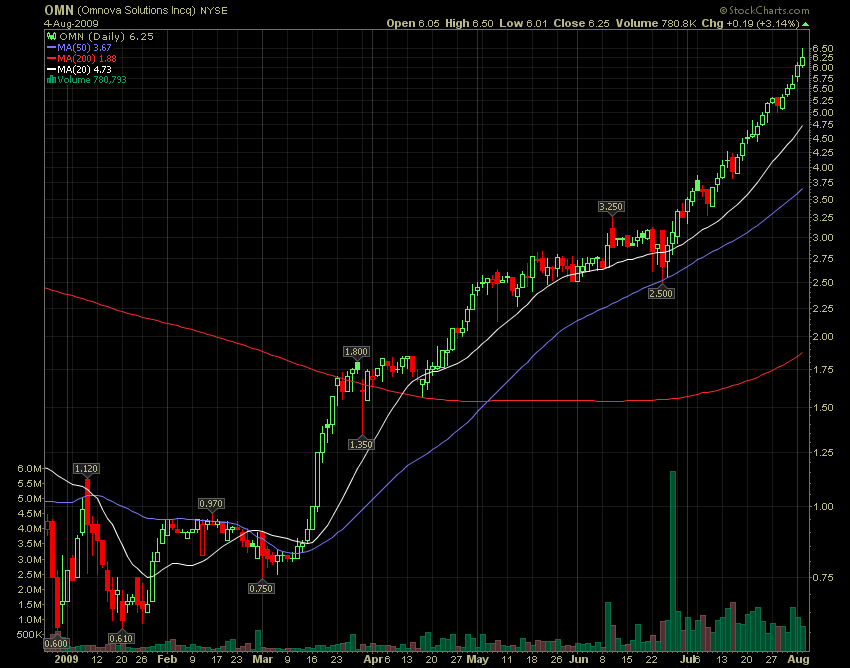
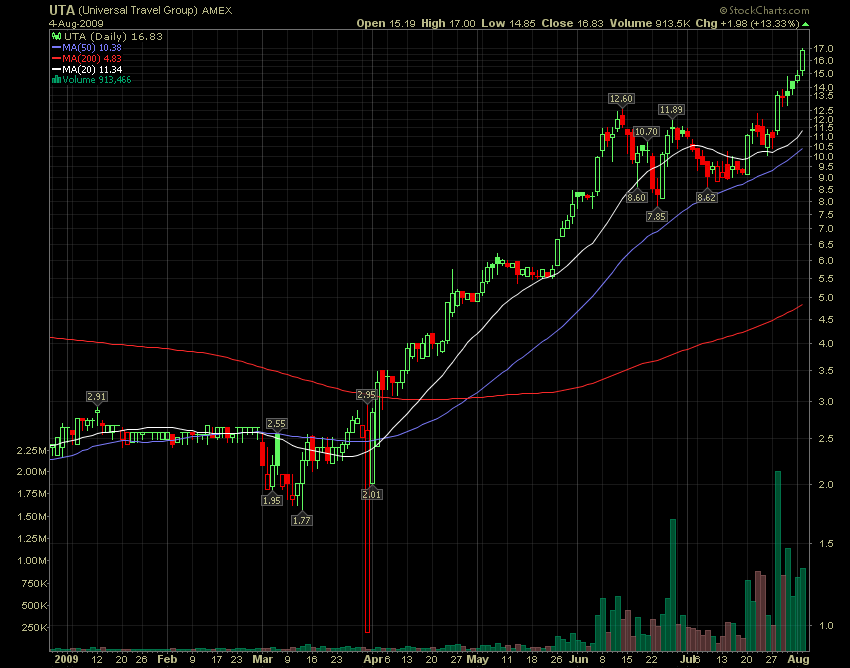
If you study the best performers YTD, you will notice that prices move in thrusts. A stock that goes up 100% in a quarter is not going to rise steadily 1-2% every day. It will experience powerful move in congested period of time. The bulk of the move will take place in one to four weeks, followed by a period of sideways consolidation in a tight range. When a new catalyst appear, there is a break out from that range and the process repeat itself until doesn’t. Entering after a break out of such consolidation areas is the smart way to trade as you will participate in the beginning stage of new momentum leg and you have a clear spot where to locate your stop (real break outs don’t go back to the old range).

A few more words about momentum. Developing traders often look at stocks that are up 30% in a day or up a lot, several days in a row and blindly short, assuming that the stock is up too much too fast and it needs to correct. They are making a fatal mistake. The fact that the stock is too overextended to be bought doesn’t mean that it has to be shorted. Market has always been irrational and what is high usually goes higher. What looks like a straight up action on the daily time frame, is often a healthy uptrend with clear periods of consolidation in the 30 min and 10 min time frames.

vci

omn

uta

Looking for the right time frame

Money can be made in various time frames and I continue to experiment with time in search for the time frame that best suits my skills and life style. The equity selection approach is the same, but each time frame has its own risk management specifics. I start the day by scanning for unusual moves. By unusual I mean remarkable price and volume. Any stock that is up more than 10% on at least 300k volume, which represents 3 times its average daily volume, is worth my attention. There are too many stocks in the scan every morning, so to limit the list to 3-4 stocks that I will be watching during the day I look for the catalyst behind the move. Is it earnings’ related, industry related or is it a biotech company? The higher the volume and the longer the stock has been neglected, the better.

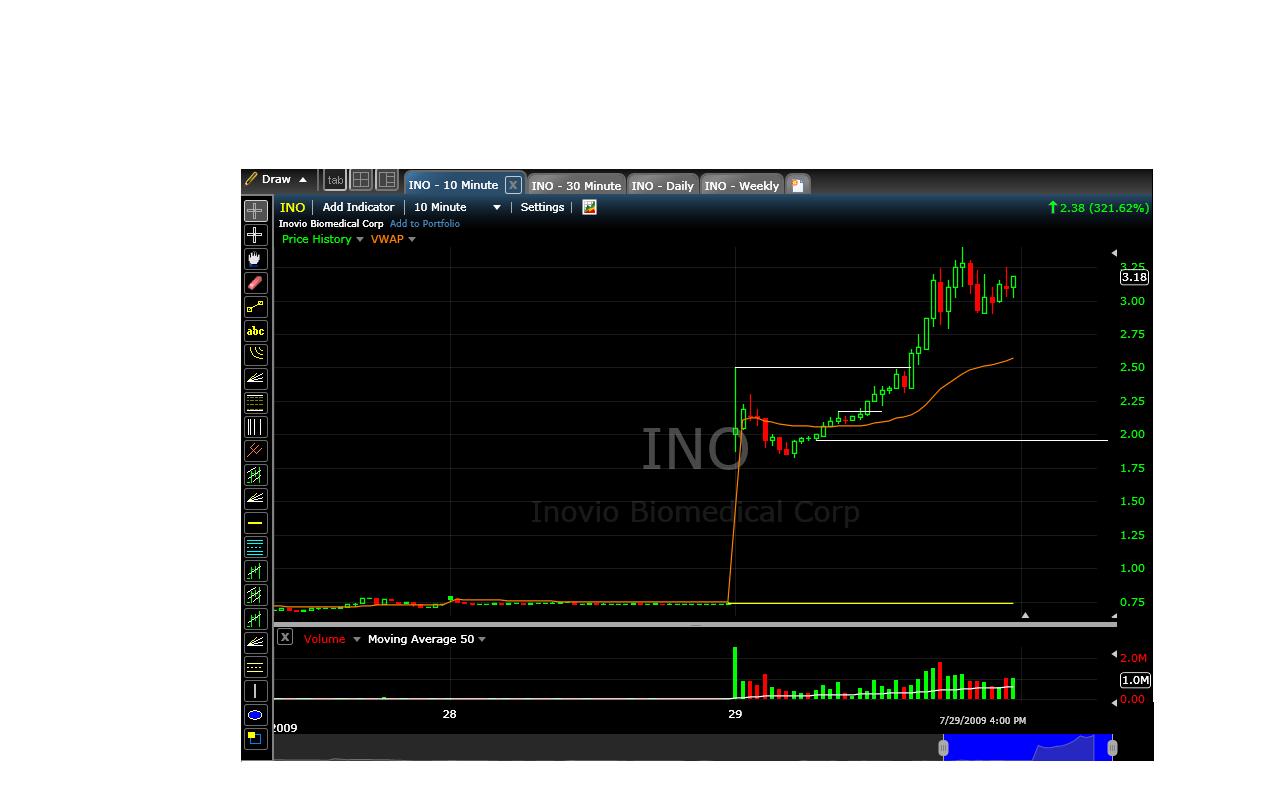
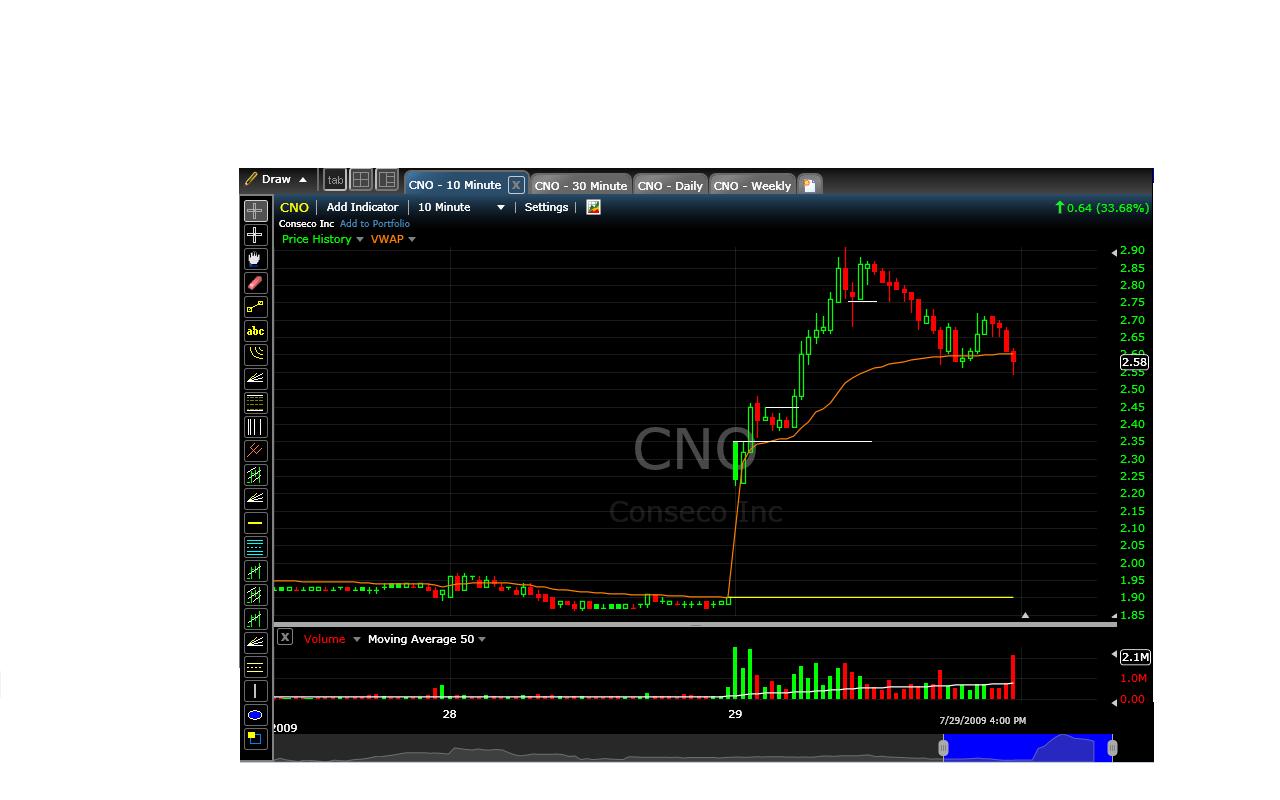
Here it is a look at two trades that I took today:

ino

1) Running scans and watching the market during the fisrt 20-30 min

2) Waiting patiently for the stock to climb back above its daily VWAP. It did so at 11:40am on its 13th bar (10 min). I saw a tight consolidation (2.05-2.17) above the VWAP over the next 50 min.

3) The entry was on the 12:30 bar (18th) at 2.18 with a stop at 1.93

4) Total risk: $200; Risk per share: 0.25; Position’s size = 200 : 0.25 = 800 shares

5) Initial target was the high of the opening range or 2.50 ( I know, terrible risk/reward of 1:1. This is the main reason I am grading this trade with B- )

6) I could have sold 1/2 position at the initial target, but I didn’t. This is also a weakness I acknowledge. Once the initial target was passed, I used a 15 cents trailing stop. I was stoped at 3.07 for a gain of 0.89 per share.

cno1) Nice bullish wedge consolidation above the daily VWAP during the 5th to 8 th bar.

2) Enter on the 9th bar at 2.45 with a stop at 2.35 (2 cents below the daily VWAP and 3 cents below the consolidation area)

3) Total risk of $200; risk per share was 10 cents; Position size = 200 : 0.10 = 2000 shares.

4) I used a trailing stop and got stopped at 2.75 for a gain of 30 cents per share.

5) I grade this trade with A, since the entry was above the opening range; it was a break-out from a bullish pattern above the daily VWAP; the stop was relatively tight, which allowed bigger position’s size.

Sometimes day trades could be really profitable, but I still feel more comfortable playing in longer time frames, where the stops are wider and therefore the positions’ sizes are smaller.