Are ICOs The New IPOs?

The number of publicly traded companies has been halved in the past twenty or so years –  from about 7000 in 1997 to about 3,500 today. The Internet boom brought many small companies to life in the late 90s. So many of them went bust during the dotcom crash in the early 2000s. Regulators stepped in and made it very expensive and difficult for small companies to become public. The decline in small and micro-cap IPOs has been the natural effect of those regulations.

Many companies had to involuntarily remain private longer. The fastest-growing among them have been able to attract a lot of cheap venture capital money and remain private even longer.  Fewer companies filing for an IPO and the best companies going public much later in their growth cycle has meant fewer and smaller opportunities for public investors. The opportunity to make 1000X or 100X in a public company hasn’t really existed in the past 15 years. Even a 10X return has been very rare for a new IPO.

Enter the ICO.

ICO stands for initial coin offering. It is basically an easy way for a company or project to raise money from investors who don’t have to be qualified. The company distributes tokens (coins) that give you access to its future product or service. What’s interesting about these tokens is that they offer an almost immediate liquidity. You don’t have to use them for the actual product or service when (if) it eventually becomes available down the road. You can speculate with them.

A token is not the same a  company share. As I mentioned, it gives you access to a future product or service. It doesn’t give you a partial ownership of a company.

First of all, let me be absolutely blunt about current ICOs. Many of them are scams and it is a matter of time before they go to zero. Many of them have been created by opportunists who intentionally are trying to steal your money. An even bigger number of ICOs has been created by people who have no clue what they are doing and for products and services for which the token model is not a good idea.

The token business model cannot be applied to all businesses. Some businesses are better managed in a centralized manner. Businesses like social media, search engines,  newspapers, digital games, identity, payments, insurance, public transportation (think Uber), etc. can thrive in a decentralized model. What is infinitely more interesting about the token business model is not that they can potentially give you an early access to the next Twitter, Uber or Facebook; it is a model that gets the incentive structure right. Maybe for the first time in human history, the people who actually contribute the most to a service or a product, will get paid the most. You don’t have to be a shrewd speculator to get paid but it won’t hurt.

Happy Holidays and Have An Amazing New Year!
Why and how buying pullbacks in momentum stocks work?

Most market edges come and go and don’t last long. One of the few market edges that have survived the test of time is momentum. The momentum phenomenon has been tested on multiple asset classes in various geographic markets. Hundreds of white papers have been written on it. They all conclude the same thing – it continues to work. I am not going to go into details how and why it works, but here is a quick summary that might spark your interest to further investigate and create your own conclusion:

  • Medium-term momentum works. The best-performing stocks for the past 6-12 months usually outperform as a group in the next 6-12 months. Studies show that most of the momentum phenomena due to industry momentum (similar stocks tend to move in groups) and the 52-week high (it is an important benchmark watched by many).
  • The worst-performing stocks for the past 6-12 months tend to underperform in the next 6-12 months. There’s one exception. Things turn upside-down in the month of January when the worst performers tend to shine.
  • Long-term momentum (3 to 5 years) and short-term momentum (1-4 weeks) tend to lead to mean reversion.

There are two basic ways to trade momentum – buying a breakout or buying in anticipation of another leg higher. Swing traders are more interested in the latter because it provides better risk/reward ideas.

Why and how buying pullbacks in momentum stocks work?

  1. Many algos are programmed to buy near rising moving averages.
  2. It is easier and more lucrative to accumulate a big position on a slight weakness; therefore it is the preferred way for institutions.
  3. People who sold their stocks too early have a hard time buying them at higher prices, so they are a lot more likely to step back on a pullback.
  4. People who have missed a move and are afraid to chase are waiting for a pullback to buy. That pullback might never materialize, but if it does, they will be there to provide liquidity.
  5. The short-sellers who haven’t been squeezed out of their positions are likely to cover on a pullback to a rising 20, 50, 100-day moving average, year-to-date volume-weighted moving average or on the first sign of renewed strength.
  6. All of the above-mentioned is usually enough to
    a) stop a pullback
    b) create a tight-range candle
    c) create a slight bounce.

Such price action within an established uptrend attracts the attention of swing traders, who pile on. Their buying leads to a new leg higher, which often surpasses the previous high.

Is Using Incomplete Weekly Charts A Chart Crime?

Some technical purists claim it is wrong to look at a weekly chart before the week has been completed. For example, you should not be looking at weekly charts on a Tuesday and make your decision based on them because the week isn’t over yet. I understand that perspective but I don’t agree with it.

Weekly charts eliminate the noise and show the big picture. They let you see trends and ideas that you can dismiss on a daily or an intraday chart. Looking at a weekly chart on a Monday can give you a headstart of what it could be.

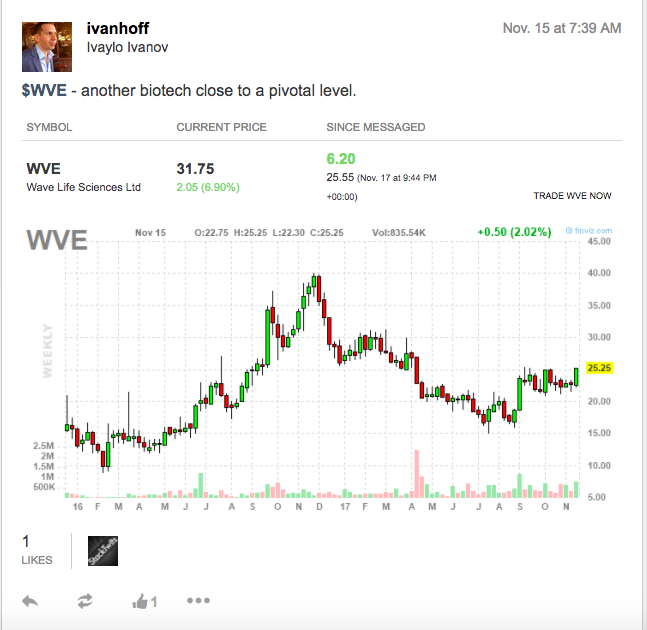
For example, I posted this chart of WVE on November 15 (Wednesday):

This is how WVE’s weekly chart looks at the end of the week. The setup and the risk to reward are completely different.

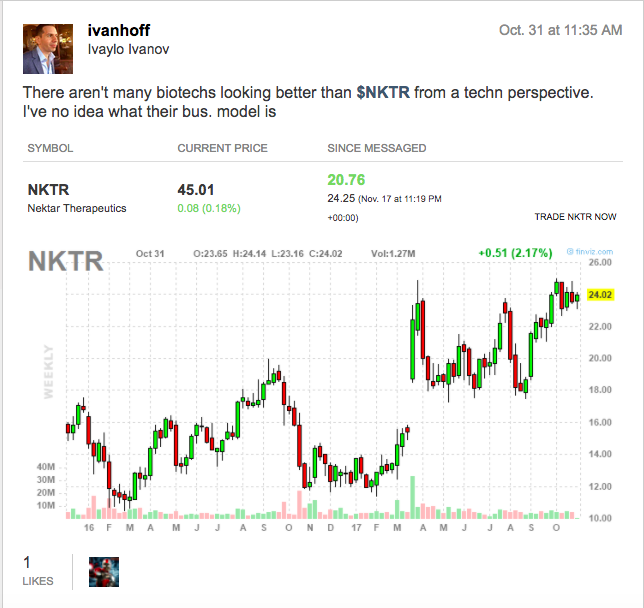
I posted this chart fo NKTR on Oct 31 (Tuesday).

You get the point.