The Best Trades of 2014

Let’s take a look at the most notable moves in 2014.

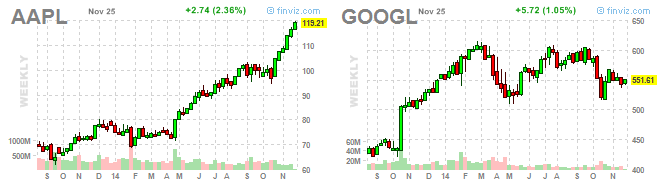
Apple is up almost 50% in 2014 after massively underperforming the market in 2013. Google was on the other side of the performance spectrum. After going up more than 50% in 2013, it is about flat in 2014, so far. Momentum in big, well-known and widely-followed names tend to reverse.

aapl

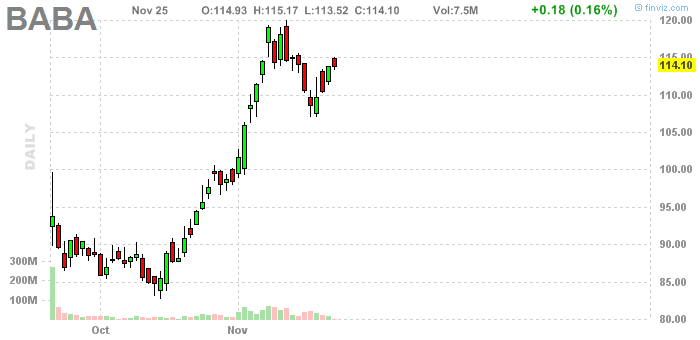
Alibaba ($BABA) was to 2014 what Facebook was to 2013 – a stock with gigantic float that surprised everyone to the upside despite of its size. Recent 13Fs revealed that Julian Robertson put 30% of its capital into $BABA. If you manage a big amount of money, there are only a few great, liquid opportunities in a year. The only way to substantially outperform the market is by taking bigger position size when those opportunities arise.

chart-4

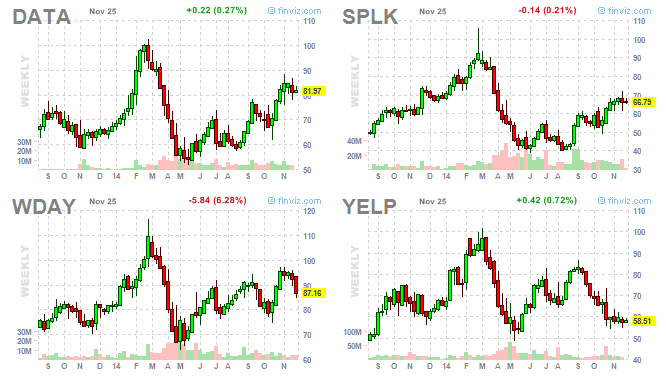
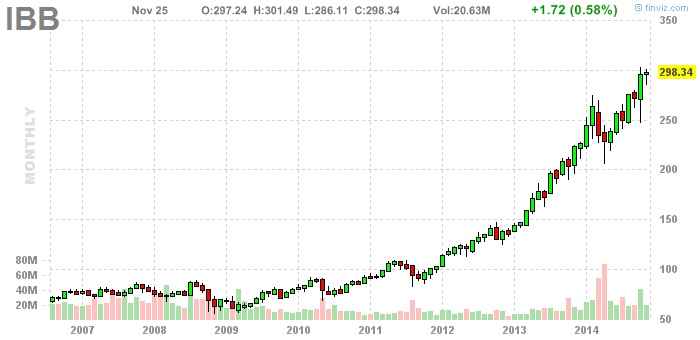
There were good opportunities on the short side too: the most liquid biotech ETF $IBB had a 30% correction between February and April. Some of its component dived 50%. During the same time, many cloud and enterprise software stocks had 50% declines.

cloud

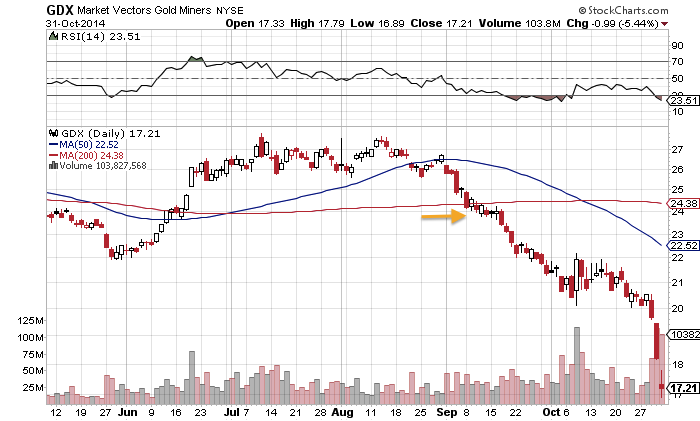
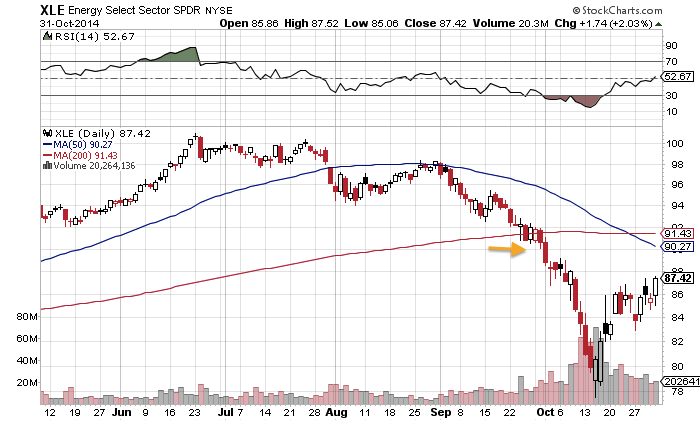
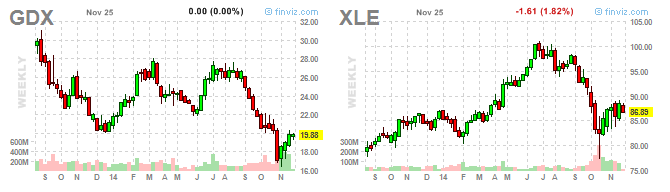
The next big short opportunity came in September/October, when the energy sector and precious metal miners were taken to the woodshed.

xle

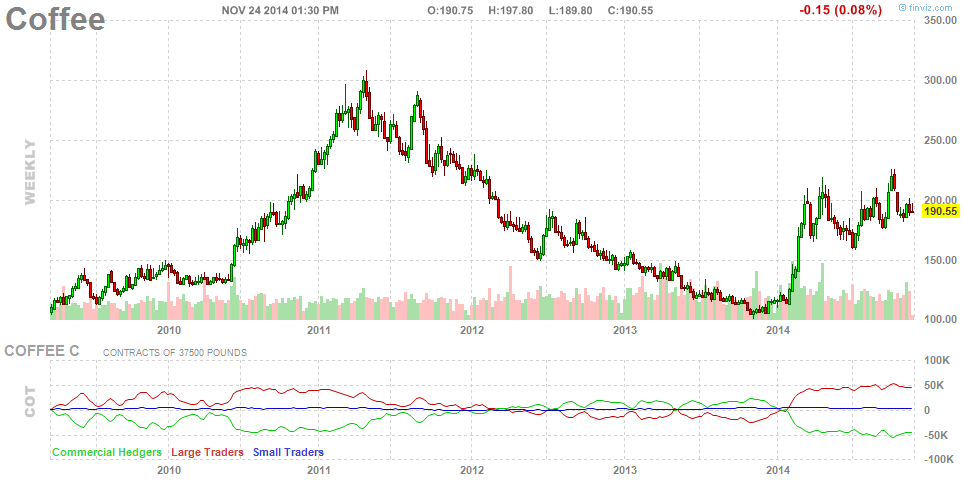
The year started strong for gold miners, soft commodities and emerging markets, but most of them gave up their gains after a strong first quarter. The beginning of the year is often a pivotal time for many beaten down names. Coffee quickly gained 100% in early 2014 after it struggled in the previous 3 years.

fut_chart

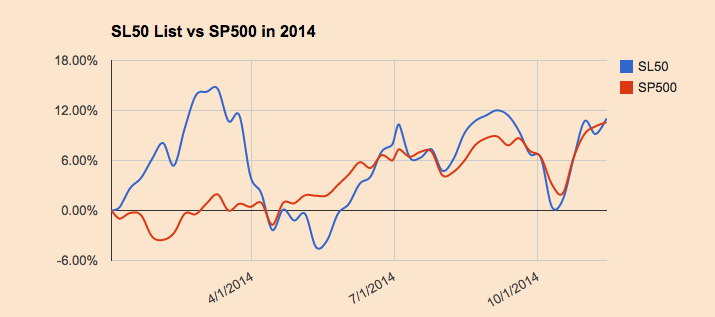
2014 started with a bang for momentum stocks.The SL50 list went up 16% in the first 6 weeks of the year while the S & P 500 was struggling. This was SL50 high for the year and it hasn’t recovered since. Biotech, cloud, social media stocks were on fire and delivered solid opportunities for nimble traders.

sl50

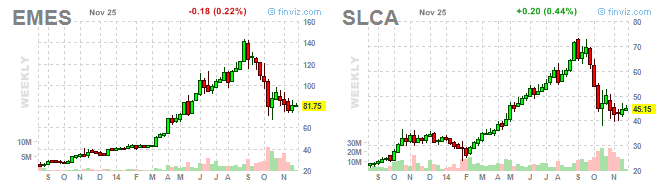
The fracking revolution created robust demand for sand and stocks like $EMES and $SLCA tripled in the first 8 months of 2014. Around that time I wrote a post titled “Sand is the new gold”. This post was picked up by Bloomberg and Zero Hedge. At few days later, sand stocks topped and corrected 40%.

emes

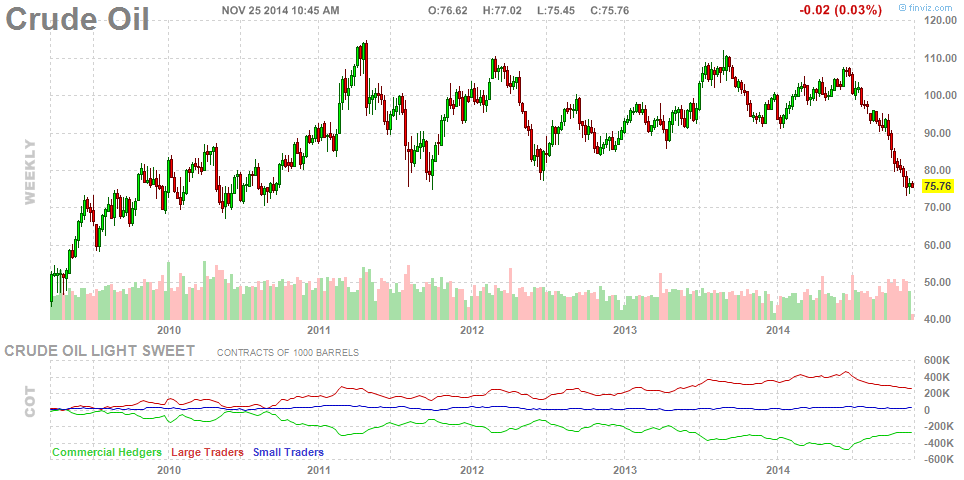
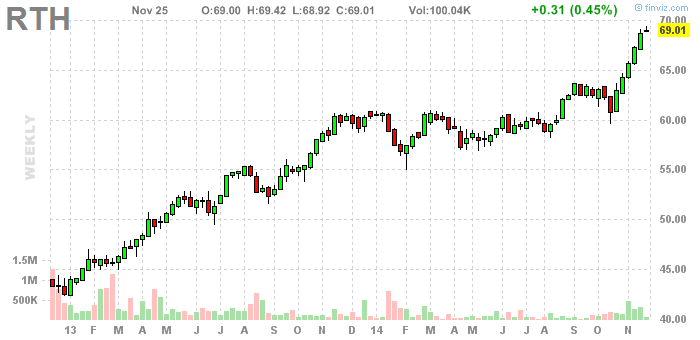
Speaking of big corrections, crude oil declined 30% from its high in June and reached levels not seen since 2011. The savings at the gas pump coupled with improving employment and consumer sentiment, put the foundations for a massive rally in consumer discretionary stocks stocks. Retailers and restaurants – industries that were left for dead in July, staged massive rallies into the year-end.

fut_chart

chart-5

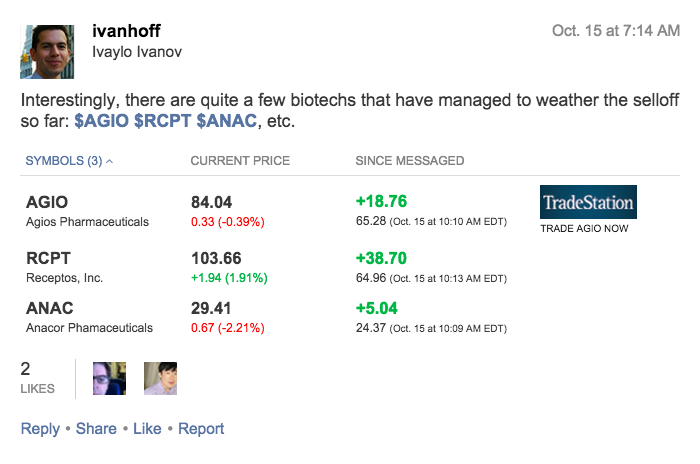
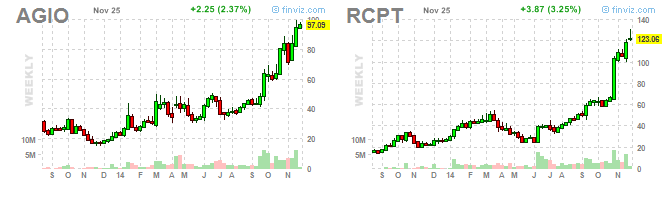
Paying attention to relative strength during deep market pullbacks could pay off. Some biotech stocks went sideways during the market correction in October. Those stocks substantially outperformed the averages after the market bounced in mid October. $RCPT doubled in six weeks. $AGIO went up 50% in the same time frame.

rcpt

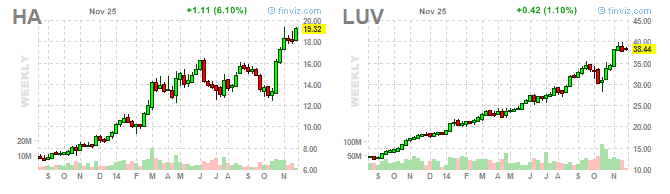
2014 was big year for transportation stocks – in the first half of the year, railways rallied because of all the newly found oil they transported from the Dakotas. In the second half, airlines hit new all-time highs as crude oil collapsed.

luv

The biotech sector has been the undisputed price leader of the rally in the past few years. It had its 30% correction in February – April, but it quickly recovered and today it is trading near all-time highs again.

chart-7

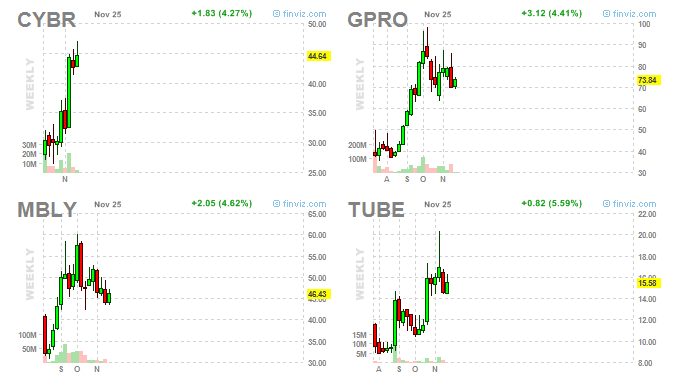
Some of the hottest IPOs of 2014: $GPRO, $MBLY, $TUBE, $CYBR, etc.

gpro

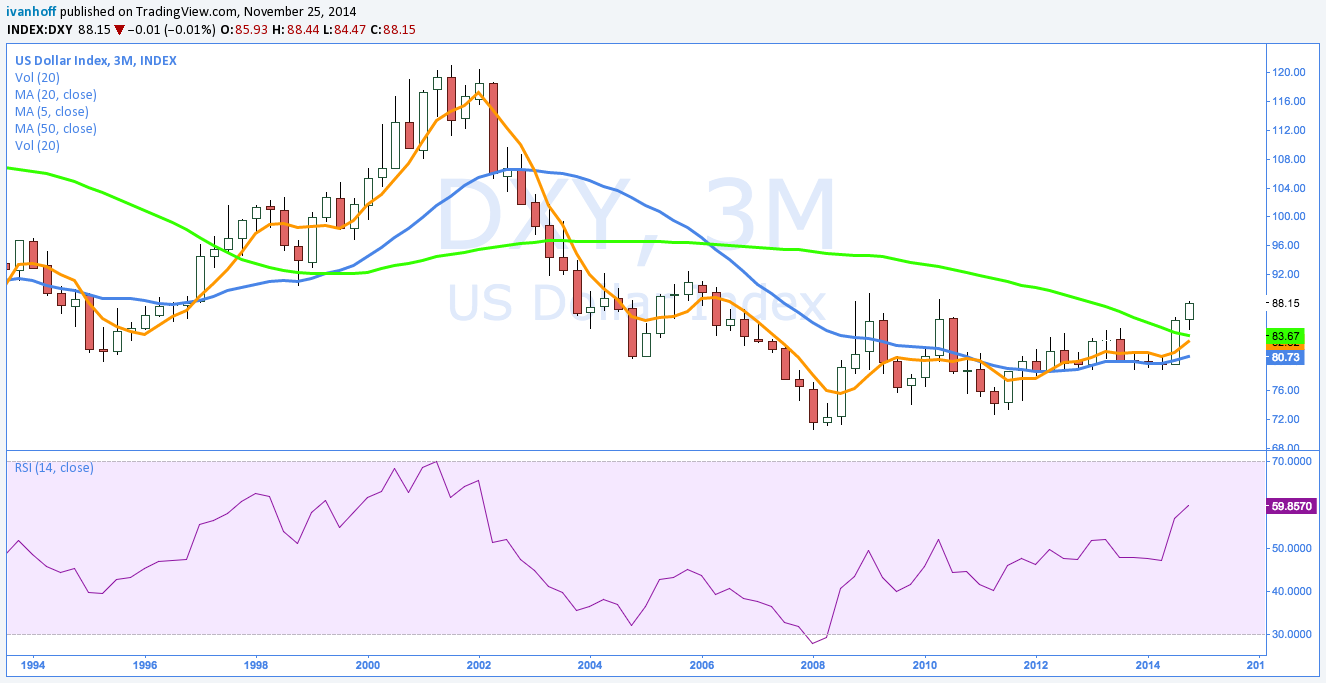
The U.S. dollar broke a major downtrend and all other currencies crashed against it, including Bitcoin (down 50% YTD after the crazy spike in 2013). I view Bitcoin more as a technology breakthrough than a currency, but we have to measure it with something, right?

www.tradingview

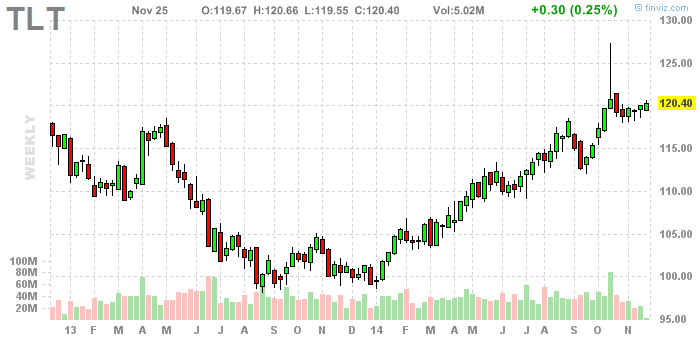
Just when everyone was positioned for interest rates to go higher, they went lower and U.S. government bonds had one of their best years.

chart-6

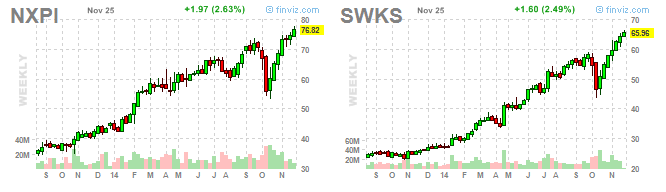
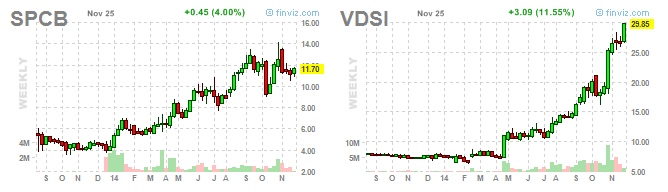
There are currently 2 billion people in the world with smartphones. This number is expected to triple in the in the next 10 years as smart phone usage per person increases too. Not surprisingly, many semi-conductors (chip makers) were on fire in 2014. Cyber security stocks also had an amazing year.

smh

vdsi

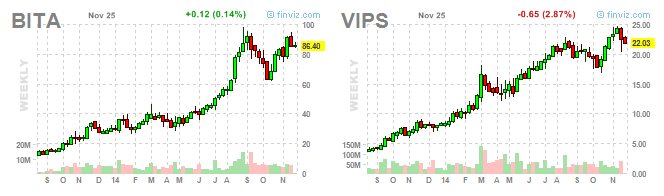
The Chinese large cap ETF $FXI is down 10% for the past 5 years, but this hasn’t stopped China from delivering unbelievable growth stories. After quadrupling in 2013, Chine online stocks $BITA and $VIPS more than doubled again in 2014.

bita

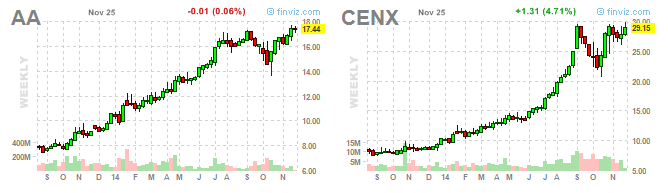
Who knew that aluminum stocks will become momentum darlings in 2014. Car manufacturers are massively switching to lighter-weight re-enforced aluminum and are one of the driving forces behind $AA and $CENX resurrection. Maybe this is a trend that will last for more than a year.

aa

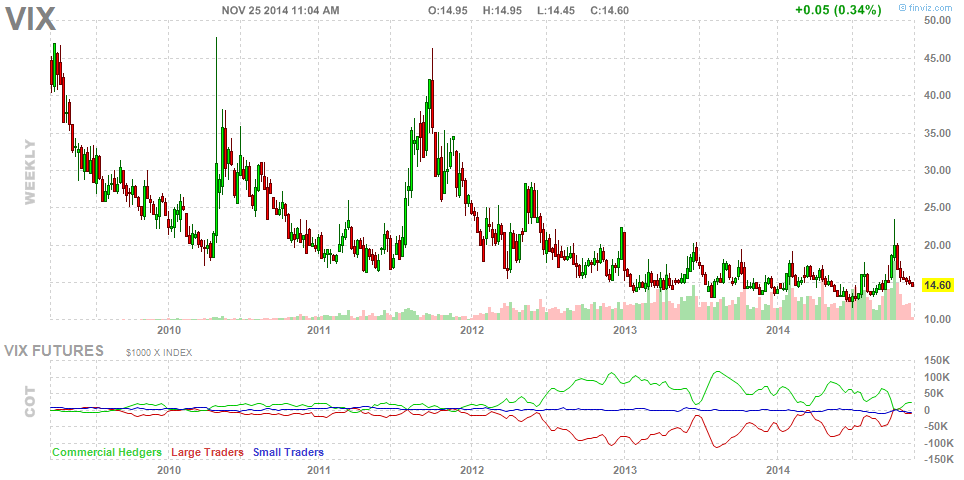
Volatility had its rare moments of glory in 2014. In October, it spiked to levels not seen since 2011. Today, it is back to where it started the year.

fut_chart-1

The year is not young anymore, but there is a whole month left and a lot could happen in December.

Did I miss something?

Check my new book: The 5 Secrets To Highly Profitable Swing Trading

Key Takeaways from the Last Market Correction

When people study corrections, they usually focus on figuring out how they could have spotted the bottom and how they could have taken advantage of the recovery. A complete study of corrections requires giving the answer to the following three questions:

1. How to protect capital during corrections
2. How to take advantage of the correction and make money on the short side
3. How to make money during the recovery

How to protect capital during corrections

The answer will depend on your time frame. During corrections, correlations move towards 1.00, meaning that the majority of stocks decline, disregarding of their individual characteristics. As a swing and an occasional position trader, I prefer to raise my cash levels in order to minimize the drawdown in my accounts; therefore I am paying attention to hints that we might be entering a correction. One of the most practical market timing indicators is the behavior of momentum leaders. They usually lead on the way down and on the way up. This is why the SL50 list is not only a great equity selection tool, but also a very useful for market timing. It started to show relative weakness in early September and gave us plenty of hints to raise cash levels before things turned nasty in October.

How to take advantage of the correction and make money on the short side

The opportunity cost of shorting is not being long. The most you could make on a short position is a 100% and these are very rare events that take a long time to come to fruition. When you are long, sky is the limit, especially in a bull market. This is why it only makes sense to focus on short position when the general market is in downtrend.

I don’t believe in long-term shorting of stocks. Maybe, it is because I don’t have the skills, the knowledge and the stomach for the volatility. Maybe, because I am smart enough to figure out that long-term, the optimists prevail and stock prices go lower. For me, shorting is a short-term adventure, which is applied only once or twice a year when the indexes undergo correction.

All corrections feel the same. At the beginning, people don’t believe them, then as prices continue lower and weakness spread to more sectors, fear escalates and it leads to forced liquidation. Forced liquidation means selling, because you have to, not because you want to. Smart investors dream to be on the other side of forced liquidation. It is easier said than done. At the lowest point of a correction, the fear of losing is substantially higher than the fear of missing out.

It is said that stocks take the stairs up and the elevator down, therefore one could potentially make a lot of money quickly during market correction if you are positioned right. Don’t be afraid to add short exposure to your portfolio. At the beginning of a correction, no one knows that we are in one, but there are good risk to reward setups on the short side. We don’t know if they are going to work. What we know is that our odds of success are higher when all major indexes are trading below their declining 5dmas, which are below their declining 20dmas.

Here are a couple great short setups during the past correction. Both, $GDX and $XLE were trading below their declining 50dma and bear-flagging near their 200dmas, before they had their fastest declines:
sc
sc-1

How to make money during the recovery

Two groups of stocks are the best performers when the market recovers from a deep correction: the ones that held the best (relative strength trades) and the once that dropped the most (mean-reversion trades)

Relative Strength Trades

Relative strength is a powerful equity selection tool, but it could be very misleading at the beginning stages of a correction. In a real correction, almost all stocks decline. Those that break out to new 52-week highs as the market averages start to deteriorate, often quickly reverse lower. From failed moves, come fast moves.

It has more value after the indexes decline for 8-10% or more. It is very simple to spot – stocks that go sideways while the indexes drop significantly. During corrections, correlations often go to 1.00. If a stock manages to hold its ground and consolidate through time or even make an attempt to make new high, it is likely being acquired by institutions. Because of the nature of their size, many institutions prefer to buy on pullbacks and during market corrections, because the provided liquidity masks their accumulation. Once the pressure from the general market is removed, those stocks tend to outperform.
One of the sectors that managed to hold relatively well during the October correction was Biotech. Many people highlighted the relative strength in select biotech names:

bio rs

Relative strength works beautifully, but not at the beginning of a correction. Pay more attention to it after 10% market pullback. Market corrections make people a lot of money. They just don’t know it at the time. After a 10% correction in the major indexes, most people are in capital protection mode or are willing to short the bounces. It is not an easy time to buy breakouts in stocks with relative strength, but you should do it – with a smaller position size, especially if the market averages show signs of bottoming.

Mean-Reversion trades

Human beings are wired to think in terms of mean-reversion and trying to fade the extremes. In bull markets, stocks could go a lot higher than anyone could comprehend or justify. During corrections, stocks could go a lot lower than most expect. Forget about levels of potential support. Bottoms are formed by strong buying, not buy strong selling. Look for wide-range, huge volume reversal candles that close above their opening level. Also, context is really important – Big prolonged market correction, happen when the indexes have their 50-week moving averages below their 200-week moving averages. I talked about it on October 15 here.

Pay attention to sentiment. If you see people becoming bold enough to write about the possibility of a 1929 or 1987 crash or that the market has 10% more downside after being down 10%, the odds are that we are closer to a bottom.

Buying oversold indexes and liquid stocks looks easy only in hindsight. It is not for everyone and it often requires averaging down. Everyone has heard of “Losers average down losers” saying which is attributed to Paul Tudor Jones – he probably knows that from experience. The truth is that there are traders who have a clear strategy how to average down in oversold ETFs and make money consistently doing exactly that. To buy an oversold index, means to assume that you are not going to be right immediately and that its prices might go much lower.

If you open with too big of a position too soon, you might
1) get liquidated as price continues to drop.
2) get so tired of holding a losing position for awhile that you are going go sell it for break-even when the bounce come and miss on bigger games when the expected bounce actually comes.

Keep in mind that not all corrections end up with a V-shaped recovery. Many of them go into long wide-range, highly volatile phase that could shake the confidence out of even the most experienced.

Many traders’ favorite new way to play a market bounce is via in the inverse volatility ETFs like $XIV and $SVXY.

Volatility tends to mean-revert, but it could remain elevated and spike to levels no one can comprehend. Shorting volatility when the VIX gets above 20 has been a really profitable approach in the past couple of years; therefore the consensus thinking is to short volatility when the VIX goes above 20. Guess what? In October, VIX briefly tagged 30, before it reversed. If you shorted volatility with a sizable position when VIX reached 20, you were probably stopped out. During the last sizable correction in 2011, the VIX remained above 30 for almost 3 months. Wait for some confirmation in terms of candle reversal pattern in the indexes, before you go with size.

vix

If you are going to take mean-reversion trades, use a variety of liquid indexes – like $TNA and $TQQQ for example. Don’t rely only on inverse volatility indexes like $XIV and $SVXY. If a correction turns into a prolonged bear market, volatility will remain elevated for a very long time and those indexes could have 90% drawdowns. Volatility could remain high longer than you could remain solvent, if your position sizing is too big. I talked about it on Oct 16 here.

Check my new book: The 5 Secrets To Highly Profitable Swing Trading

The 5 Secrets To Highly Profitable Swing Trading

swing tradingThere are two major ways to consistently make money in the market:

1) Hunt for several huge winners in a year. Build large positions in them and ride them for monstrous gains.

2) Hunt for hundreds of 5% to 30% short-term winners, where the goal is to compound capital quickly by actively moving in and out of them.

There is not right or wrong approach here. Both have place in the arsenal of each active market participant.

Everything comes at a price. If you want to catch a 200% to 300% long-term winner, you have to be willing to sit through multiple consolidations and several bigger than 30% pullbacks. Not everyone has the stomach to ride big stock market gainers, but maybe you don’t have to.

If you sell all your winners, when they are up 20%, you will never catch a double or a triple. Fact.

What is also true is that in any given year, there are a lot more 20% moves than 100% moves. If you learn how to catch hundreds of quick 5% to 20% moves, your capital could appreciate very quickly while you keep you keep the drawdown in your account to a minimum.

Swing trading is among the fastest way to grow capital if you learn how to properly apply its principles. Swing trading is all about velocity and opportunity cost of capital. The goal is to stay in stocks that are moving quickly in our favor and avoid “dead money” periods.

Stocks move in 5% to 30% momentum bursts that last between 2 and 10 days, before they mean-revert or go into sideways consolidation. The goal of every swing trader is to capture a portion of a short-term momentum burst, while avoiding consolidation periods. Then to repeat the same process hundreds of times in the year by risking between 0.5% and 1% of capital per idea.

The beauty of swing trading is that it provides many signals. You don’t need to risk a lot per signal. You won’t second-guess yourself whether to take a signal or not. One trade is not going to make your year or your month, but it also won’t ruin it. It relies on the magic of compounding. The idea is to grow capital quickly by being leveraged to the hill during favorable periods and being mostly in cash during unfavorable periods.

I know that if you apply the principles I describe in this book, you will become more knowledgeable, more profitable and happier market participant.

Here is a brief overview of what you could expect to learn:

1) What drives short-term market moves? How to recognize perfect swing setups; when to buy them and where to put your stop losses.

2) When to sell and how.

3) How to be more profitable. How to improve your success rate and where to hunt for big short-term gainers.

4) How to manage risk properly. How to decide how many shares you should buy of every stock you like. How to check if you have an edge in the market.

5) How and why to time your market exposure.

This is a really good book on swing trading. Check it out on Amazon.

logo_dark