Divergences and Setups Abound

U.S. equity buyers stepped in where they were supposed to step in and after a week of volatility spikes, dip buyers are on the winning side again.

The good news – the recent pullback has helped form quite a few good risk to reward setups. A lot of stocks consolidated side-ways and started to break out near the end of the week when the market averages bounced higher. The St50 list gained 0.93% for the week, outperforming the averages.

The bad news – we are still in a range-bound market, which will continue to deliver a lot of fake breakouts and breakdowns.

Speaking of range-bound and fakeouts, this seems like a good time to talk about the so called “taxi driver syndrome”: people tend to get more active where there is less work to do in order to compensate for the smaller revenue stream and less active when there is a lot of work. In reality, they would do a lot better if they are more active when there is more work to do and just take the day off when there is less work. The same applies to traders and investors. In a higher volatility environment most people naturally make less money, so to compensate, they trade more and try harder for little or even negative results. In clean trending environments is a lot easier to make money, so most people don’t sweat it too much and don’t press to take advantage of the opportunities.

People’s expectations for making equal amount of money every week or month could cause a lot of harm. The return curve in the market has very fat tails – a few stocks and a few months will account for the majority of your annual gains.

Let’s take a quick look at the major asset classes to see where we stand:

major assets

The U.S. Dollar ($UUP) has its worst week in months. The only commodity that benefited from the Dollar’s weakness was crude oil ($USO), which spiked close to 5%. When all is said and done, the “black gold” is still in no man’s land and it doesn’t seem to be going anywhere soon.

The U.S. Dollar and U.S. equities have been going in the same direction for the better part of 2013 and they finally part ways last week. One week does not make a trend, but it is something to watch carefully. Correlations change, but they also tend to continue for years as this chart from Chris Kimble reveals:

dollar:equities

Speaking of divergencies, have you looked at emerging markets ($EEM) lately? They have been underperforming in 2013 and last week broke down to levels not seen since last December, where they sit at major support. The odds are that we might see some type of a bounce there in the coming couple weeks. Despite the weakness in emerging markets, many of the Chinese ADRs are in good shape and had another decent week – $JOBS, $SINA, $BIDU, $CTRP etc.

Interest rates continue to rise as U.S. Treasuries ($TLT) lost ground for a 7th week in a row, dropping to new 52-week lows. Despite the recent spike in yields, they are still near historic lows and financial stocks continue to benefit from the steepening of the yield curve. Among the biggest gainers last week were investment banks, brokers and asset management firms.

Cancel that vacation to Japan. The Yen ($FXY) had a monstrous week and recovered some of its humongous losses since December, but it is still in a downtrend. There are trillions of dollars behind the yen carry trade and the moves there have major implications for all asset classes. Strong Yen is supposed to be negative for equities, but we saw a divergence in that relation near the end of the week.

Take a look at the latest St50 List here.
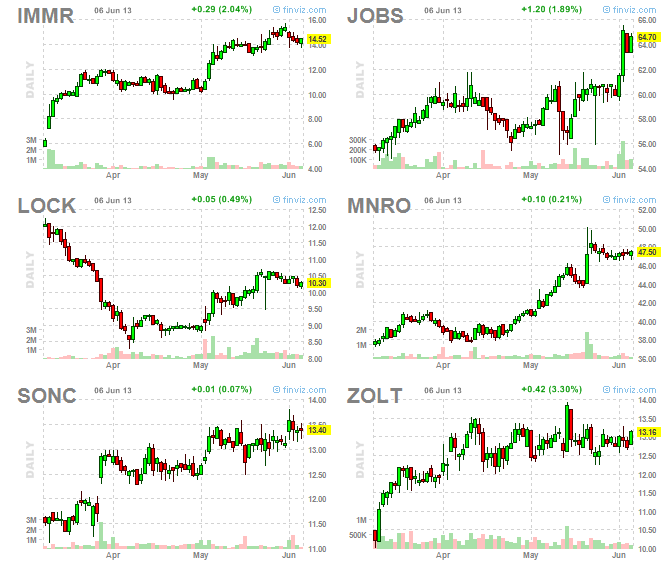
If This Bounce Has Any Legs, Watch Those Six Stocks

The S & P 500 bounced from its rising 50dma today despite the big rally in the Japanese Yen. Every single hedge fund under the sun and its grandmother is short the Yen in size, so a strength there naturally puts pressure on equities and bonds. The world still trusts Bank of Japan’s ability to beat the crap out of its currency, so the pullbacks in equities have been orderly so far, REITS and high-yield assets being the exception.

There is still plenty of risk appetite for buying dips in select U.S. equities. Today’s bounce does not change the big picture. We are still in a range-bound market environment with elevated volatility – an environment that is known to produce a lot of fake breakouts and breakdowns and be more favorable to mean-reversion setups from important technical levels (look at the bounces in $SPY and $IYR today). This does not mean that the market won’t look strong or weak for 2-3 days in a row. It will look strong or weak long enough to convince most market participants to lay in one direction and then it will swiftly pull the rug under their feet.

With that in mind, there are still plenty of opportunities for nimble traders that manage to quickly adjust to the new market environment and realize that many breakouts and breakdowns are likely to deliver a lot smaller gains than what we got used to in the first 5 months of the year. Here are six stocks that have managed to withstand the pullback and are setting up again:

Screen Shot 2013-06-06 at 3.06.35 PM

Do Less, Cut Position Size

The best traders and investors know when to be aggressive and take advantage of a healthy market and when to slow down, do a lot less and protect capital. Everyone makes money in an uptrend. Not everyone keeps it when the inevitable choppiness comes.

If you expect the media to tell you that we are in a correction, you will have to wait for a 10% pullback for that to happen. This is not helpful. We have to observe the subtle changes in market character and manage risk proactively and in real time.

After the reversal on May 22nd, I mentioned that we have entered a new market environment that will require tactical adjustment. The chasing is not going to be mindless anymore and we are likely to see a lot of false breakouts and breakdowns. Overly active traders that fail to recognize the changes are likely to suffer a “death by thousand cuts”.

So has the market changed? Look at the 30 min chart of the $SPY below. One of the better definitions of a healthy trending market is one that trends above a rising 5 day moving average (which was the case for the better part of May) or below a declining 5 day moving average (which we haven’t seen since last November). The new reality – high volatile choppiness. The $SPY pierced through its 5 day moving average (which on a 30 min bars is 65-period MA) seven times over the past seven days.

spy

The St50 list gained 0.5% for the week, but under the surface there was a lot of damage that became especially pronounced on Friday afternoon and many of the price leaders gave back a substantial part of their weekly gain.

The weakness on Friday was all-encompassing, but especially heavy in energy, basic materials and emerging markets. The St50 list managed to finish green for the week only because it has very little exposure to those sectors.

There were four earnings reports on the St50 list last week – all of them saw relatively positive market reaction: $KORS $SPLK $LGF $GWRE.

What else important happened last week

The most interest rate sensitive assets continue to get clobbered in an accelerated fashion as fears of the FED tapering its monetary efforts are driving the yield higher across the whole risk curve.

Screen Shot 2013-06-01 at 7.19.42 AM

The financial sector exhibited notable relative strength.

This is what happens in an environment of rising interest rates expectations. The yield curve is getting steeper. People are more likely to borrow today if they expect the cost of borrowing to rise tomorrow;

Market exchanges and brokers are also seeing buying interest as the market is betting that people’s interest in equities is gradually returning.

The Ultimate contrarian indicator resurfaced. A non-business media featured the stock market in positive light on its cover. Covers are not a precise timing tool, but it is something to keep in mind as financial markets are often counter-intuitive to common Main street’s logic.

ustoday

Consumer confidence is at multi-year highs. Apparel retailers had a decent week.

Corporate buybacks continue with full force.

Priceline issued convertible notes for $1B to finance stock repurchases. Data shows that most of those buybacks are done to mask the dilution caused by executive stock options. Nevertheless, it is a net positive for the shareholders in short-term perspective. Long-term, not so much – companies are increasing their debt levels and buying back assets at very high valuations. Everyone is myopic and everyone is focused on short-term results, so this is what we have. Borrowing for buybacks is the most popular game in town and everyone is playing it, which puts an underlying bid for equities. The bull market in the mid 80s was also fueled by buybacks. The difference is that this time, the interest rates are a lot lower.

There is no scarcity of good looking long setups on the St50 list and in the market in general – $CHUY $AMBA $CERN $PRO $CERN $EFII $ININ. In high-volatile, choppy environment, the success rates of breakouts is a lot lower. Many will either fail to follow through or deliver much smaller gains than usual. Welcome to the range-bound market reality. The more active you are, the bigger the damage you are likely to cause to your capital. One way to deal with the new reality is to do less and cut position size.

See the latest St50 list here.