Railroad Stocks Are Setting Up Again

The beauty of prolonged market uptrends is declining correlation. It is a “market of stocks” environment, where corrections take the form of sector rotation. While one leading sector is taking a breath from a recent spike, another that has been consolidating takes the lead and breaks out.

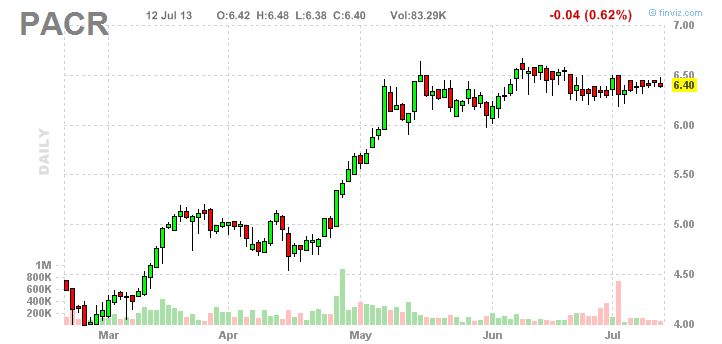
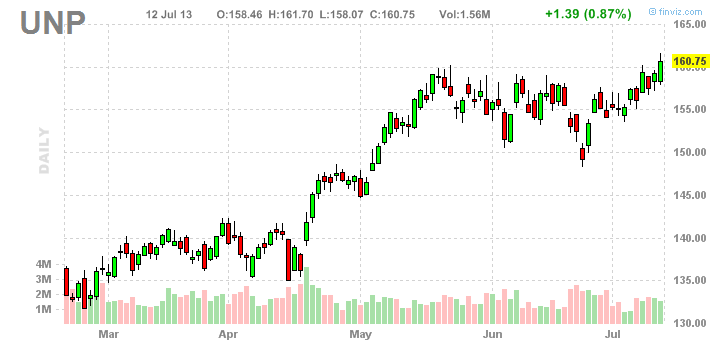
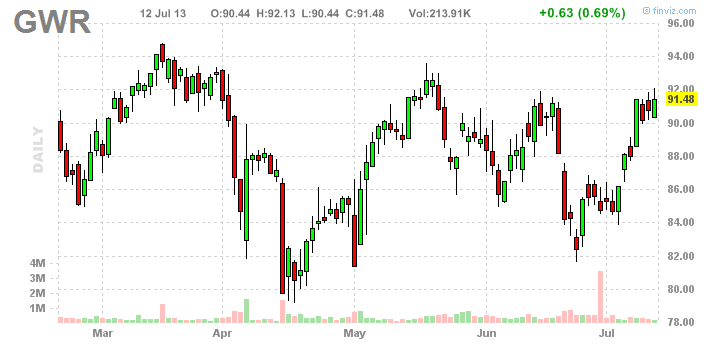
Quite a few railroad stocks have been quietly building new bases over the past couple months and the renewed strength in the overall market might be the catalyst that helps them to break out to new multi-year highs. Don’t forget that we are also in the midst of an earnings season. Quarterly reports will play a significant role and could be the proverbial tipping points that start, accelerate or end an existing trend.

Take a look at these three setups in the railroad industry:

Screen Shot 2013-07-14 at 7.52.23 PM

Screen Shot 2013-07-14 at 7.52.35 PM

Screen Shot 2013-07-14 at 7.52.55 PM

How Are The Best Performing Stocks Of The Past Year Faring These Days

Screen Shot 2013-07-06 at 12.35.37 PM

As of today (July 6th), 171 stocks have doubled in the past 12 months. Relative strength beyond 2-3 years often leads to mean-reversion, but numerous studies have shown that stocks that outperformed in the past 3, 6 and 12 months are very likely to outperform as a group in the next 3, 6 and 12 months. The logic is very simple – stocks that go up 300% in a year, are only up 100% at some point of time. How have those stocks fared recently?

82 of the 171 doubles, went up 5% or more over the past 5 trading days.

32 of the 171 doubles, went up 10% or more over the past 5 trading days.Some of the biggest gainers include: $CLDX $AFOP $PBYI $ALNY $XRM $JKS $SPWR $PSUN $WGO $OWW

If you study carefully the best performing stocks in 3, 6 and 12 month horizons, you will positively reach the conclusion that during their rise, they form multiple smaller bases and give multiple opportunities for swing traders to profit handsomely. Granted, some people prefer to be less active and ride such stocks for as long as possible, without having to watch every tick. There are various different ways to approach the market and stocks that have already doubled are a good tool for both swing traders and investors. The main reason for that is psychological. Imagine how many people would dare to even consider stocks that have already doubled. Probably most would rather stay away. Market opportunities exist where most people are not willing to go. This is why over time, value and momentum have remained the two most reliable alpha generators. They are psychologically hard to practice.

One of the most simple and effective swing trading systems is to scan for stocks that have already doubled in the past year and then to look for some form of consolidation through time (sideways move) over the past 1-3 months. Keep in mind that those stocks are extremely volatile, which is a benefit in healthy markets, but a huge drawback during corrective times. You could learn more how to improve the odds of finding higher probability swing trading candidates here.

You could use various entry techniques:

– buy when it clears new 52-week highs;
– buy on a 3%+ move;
– buy in expectation of a breakout those stocks that are setting up near 52-week highs.

Everyone has a buying strategy. Very few have a well thought out selling strategy. Many of those high momo stocks are capable of delivering 10%+ moves inside a week, so risking 3-4% to make 10% is not a bad tactic.

A quick scan revealed the following rather enticing swing setups for next week: $ACAD $SBGI $NFLX $RVLT $CLVS $SNTS $SAIA

st50_ad_leaderboard_20130626

Market Performance After Big Crashes

Some of you have probably heard the saying “Bear markets make people a lot of money, they just don’t know it at the time”. This morning, Meb Faber is out with some interesting observations that confirm the same notion. What is the 3-year return of different asset classes after they have crashed:

Average 3 year nominal returns when buying a sector down since 1920s:

down 60% = 57% recovery

down 70% = 87% recovery

down 80% = 172% recovery

down 90% = 240% recovery

Should this data encourage you to hold forever to your losers and remain fully invested in any market environment? No, let’s take a quick look why:

If an asset drops 90%, let’s say from $100 to $10; then a 240% gain will bring it back to $34, which is still 66% below the starting price. Not a big consolation, right?

We all know that momentum works best in a 3 to 18 months time frame and anything beyond 3 years, usually leads to mean-reversion. Sooner or later all uptrends and downtrends end. Some downtrends end with bankruptcy.

Any asset that is down 90% is probably priced for bankruptcy in some way or another. Of course, if the perceptions turn out to be much worse than the reality and that asset survives, it will rally big time and be among the best performers during the recovery process. We all saw the massive 1000%+ returns from the 2009 bottom in some of the cyclical stocks – truckers and furniture stores. Buying a basket of small cap stocks after big market crashes has worked flawlessly in the U.S. over time.

The big question is – do you buy blindly, any time an asset is down 80%? What if it gets to a point being down 90% from its original price? A move to being down 90% after being down 80% is a another 50% loss. (From $100 to $20 to $10). There have been numerous bottom hunters in the coal industry over the past couple years, only to find out that there is a hole in the bottom later. What if an asset that is down 90% gets to a point where it is down 99%. It happened in Cyprus.

To take advantage of such massive crashes, you have to keep your powder dry. You need to protect your capital in signs of weakness and actually cut your losers when their trends get broken.

There is a way to use market crashes to your advantage, but it is not by buying blindly anything that is down 80%. I will talk about it in another post.

st50_ad_leaderboard_20130626