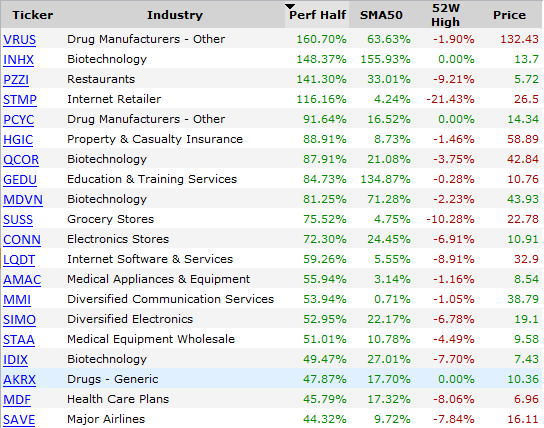
It is a habit of mine to keep track of the best performing stocks over different timeframes. While the survivorship bias could certainly distort the results, there is no better way to pinpoint the mutual characteristics of winning/losing stocks.
Over the past 6 months, $QQQ and $SPY fell 10%. Correlation is usually high during downtrends or with other words, most stocks tend to move in groups. The so called “all-or-nothing” days, where 90% of all stocks go in one direction or market averages gain or lose 7-8% in a week are typical in such environment. But below the surface, there are always stocks that manage to defeat the status quo and stand out. Below I outline some of the common characteristics of the winners over the past 6 months – traits they had as of May 29, 2011:
18 of them had market cap under $1B 6 month ago. Small caps are naturally more volatile and tend to occupy the first places of most best and worst performing lists.
8 were less than 10% from their 52week high
15 were above their 50-day MA
11 had outperformed $SPY over the past year
4 were acquired over the past 6 months
7 are biotechs or drug manufacturers. Nothing surprising here. The price action in these type of stocks is rarely influenced by the general market
