Momentum Monday – Looking for Relative Strength

All charts on Momentum Monday are powered by MarketSmith

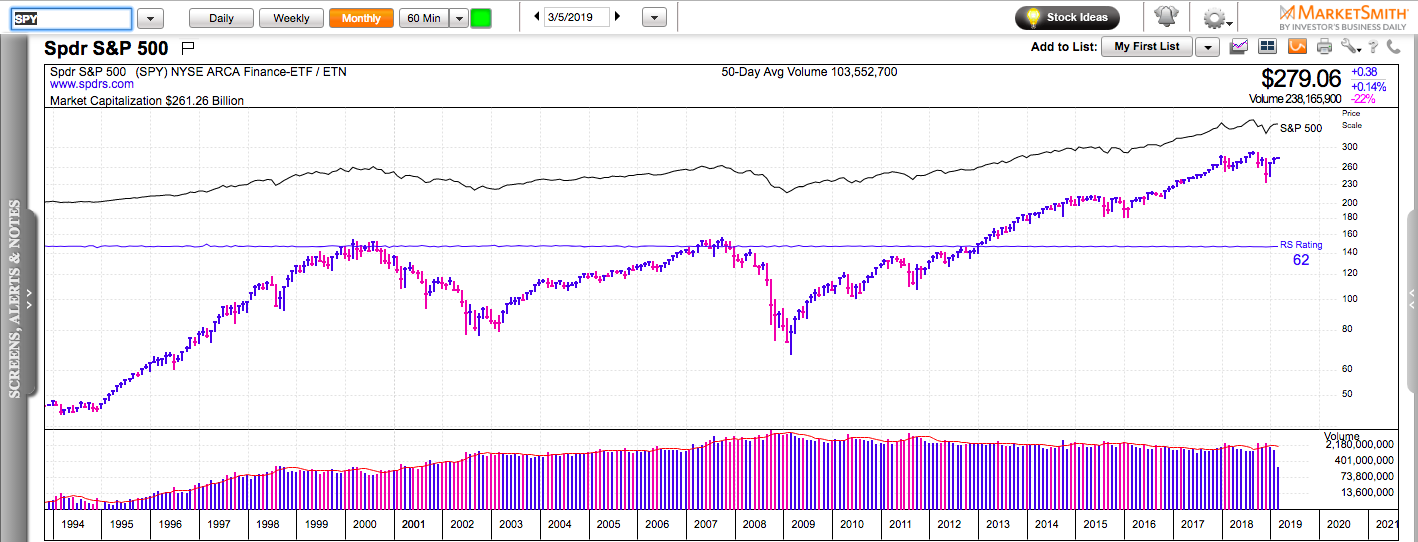
The major U.S. stock indexes pulled back from areas of major resistance. $280 for SPY, 175 for QQQ, and 160 for IWM (Russell 2000). Is this the beginning of a significant leg lower or just another garden-variety shallow correction. Judging by the price action in many momentum stocks, it looks more like the latter.

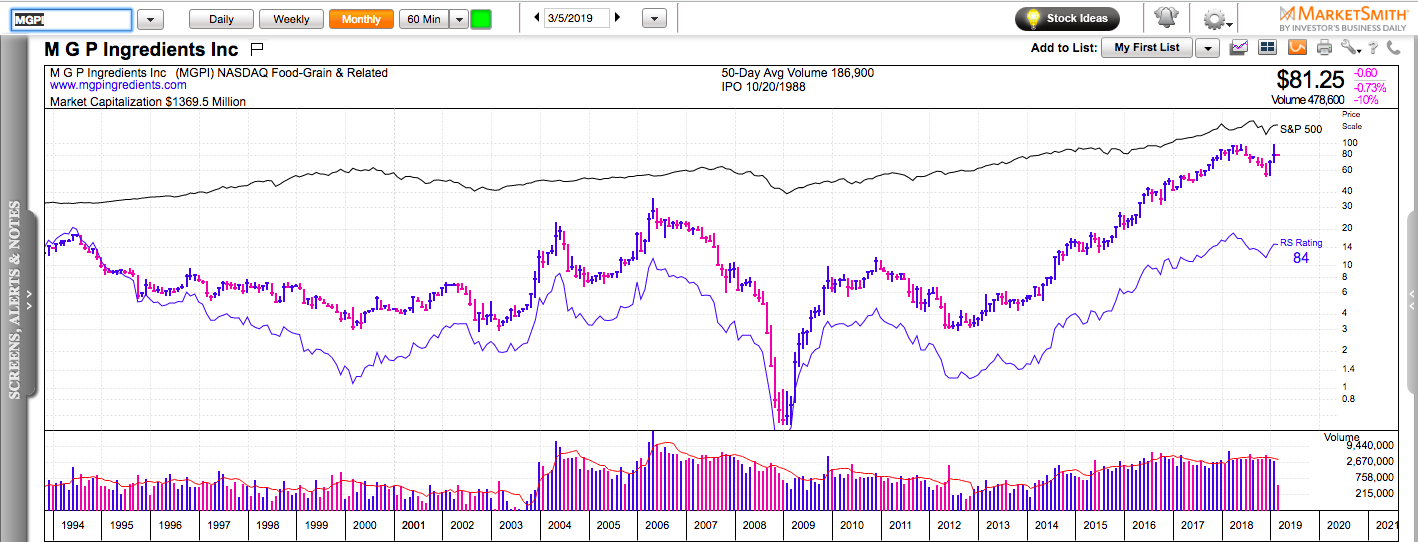
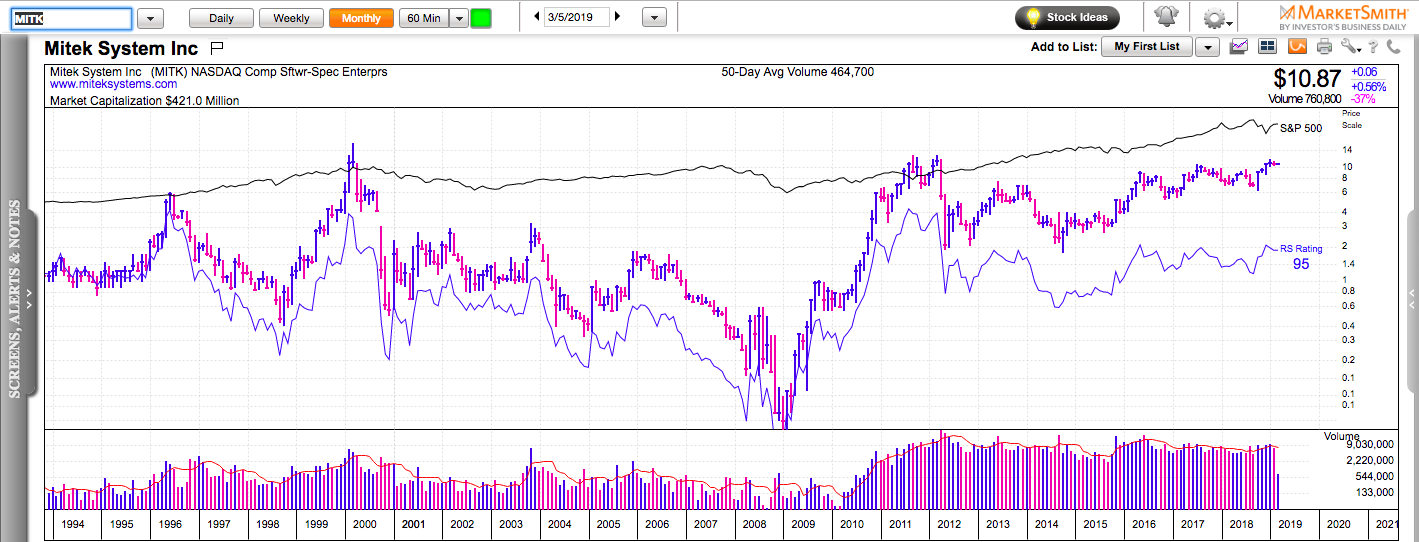
Momentum stocks are often leading the market, higher and lower. If the market declines and most momentum names go sideways or even try to break out, the correction is most likely a buying opportunity. This is exactly what are seeing in the current market.

Keep in mind that no indicator has a 100% success rate. If some unexpected news comes out of nowhere and surprises the market, those same momentum stocks will get hit hard and will fall with the rest of the market. This is why I am using the expression “most likely” – it’s a probability, not a certainty.

Check out my latest book: Swing Trading with Options – How to trade big trends for big returns.

The Best Performers of the Past 10 Years

All charts in this post are powered by MarketSmith

This week marks ten years since the bottom of the Great Recession in March 2009. Since then, the S&P 500 has almost quadrupled (total return), Google is up 6x, Apple is up 9x,  AMZN has gone up more than 20x, and Netflix is up 54x (after experiencing an 80% drawdown along the way).

In March 2009, the market was in panic mode. Many stocks were trading like their companies were going out of business. This is why many of the best performers in the past decade were under $5 per share (some were even under $1 a share). Bear markets create incredible long-term opportunities, but most people are not psychologically equipped to take advantage of them. Holding big winners for the long-term is never as easy as it seems in hindsight.

In the past decade, there are 235 stocks that went up more than 1000%.

Out of them, 81 gained more than 2000%.

Out of them, 42 increased more than 3000%.

Out of them, 14 rose more than 5000%.

With returns like these, who needs angel investing?

Here are the top five performers for the past decade:

1.PATK +21,546%

2. JAZZ +15,010%

3. NXST +14,713%

4. MGPI +10,940%

5. MITK +10,720%

Check out my latest book: Swing Trading with Options – How to trade big trends for big returns.

Momentum Monday – Bull Markets Often Correct Through Sector Rotation

All charts on Momentum Monday are powered by MarketSmith

After a big run in January and the first half of February, the S&P 500 is consolidating in a tight range above its 200-day moving average. While some of the tech leaders are starting to lose upside momentum and the FANGs are treading water, there are quite a few other sectors that are stepping up to the plate. Biotech had a monster breakout last week and it is likely to remain the pond to fish for active traders in the next few weeks.

People are obsessed with catching bottoms and tops. One can understand the fascination with this market approach. It’s based on a mean-reversion, which is contrarian by nature and everyone wants to be a contrarian. It has the potential to deliver a reward multiple times bigger than the taken risk assuming you are willing to cut your losses quickly. It looks good in theory but it is too hard to implement in practice. In the long-term, playing against the established trend is a losing proposition for most market participants. Focusing on capturing parts of trends is a much more common-sense approach, which can deliver a lot better return with a lot less hassle over time.

Check out my latest book: Swing Trading with Options – How to trade big trends for big profits.