Quick Look At Market Breadth

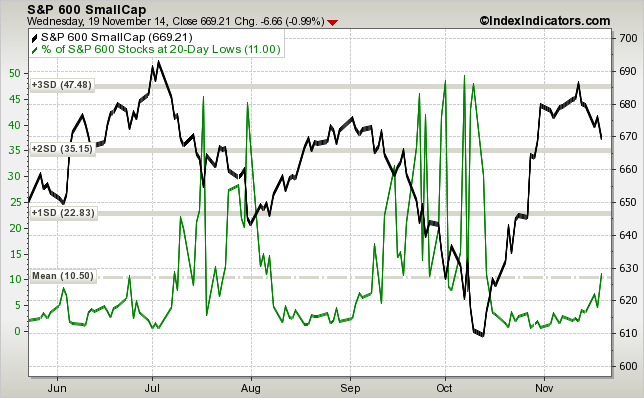
The breadth in small caps continues to deteriorate. Not only are new 20-day lows back below 10%, but new 20-day lows are picking up too, which is an indication of increasing selling pressure:

sp600-vs-sp600-stocks-at-20d-highs-params-6m-x-x-x

sp600-vs-sp600-stocks-at-20d-lows-params-6m-x-x-x

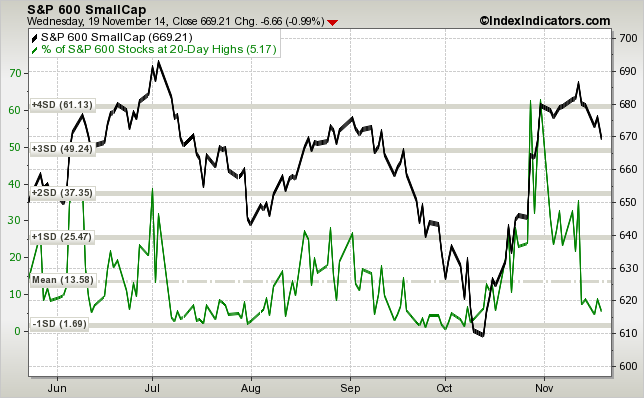
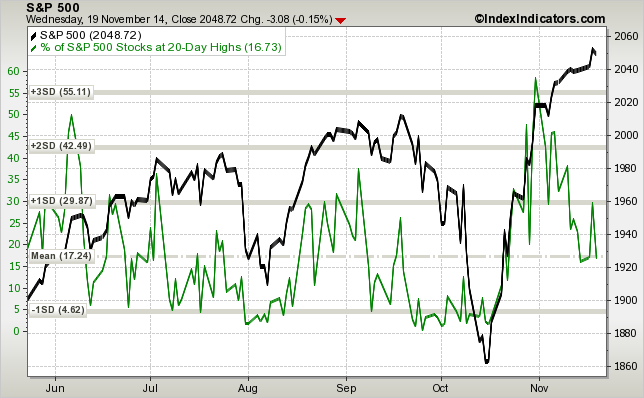
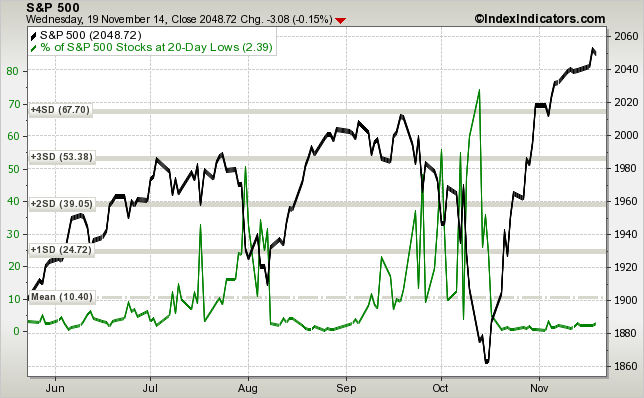
The situation in large caps is different – $SPY has been making new all-time highs on a smaller and smaller number of stocks making new 20-day highs. This is not too unusual after a bounce from a significant pullback. Typically, correlations are very high during the initial stages of a recovery – most stocks bottom together and move higher together. The next stage of a recovery is a market of stocks environment, where stocks start to trade on their individual merits. The big difference in large caps is that the number of new 20-day lows has flatlined. Overall, it means that while people are not too excited about chasing at these levels, they are also reluctant to sell large caps, for now.

sp500-vs-sp500-stocks-at-20d-highs-params-6m-x-x-x

sp500-vs-sp500-stocks-at-20d-lows-params-6m-x-x-x

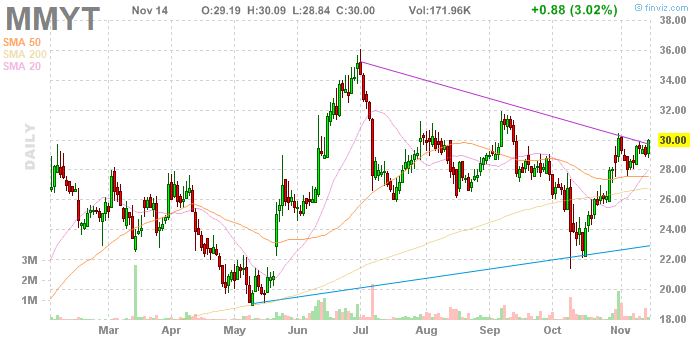
One could make the argument that small caps and momentum stocks in general typically lead on the way down and on the way up, but as we have seen over the past couple years – divergencies could continue for quite some time. Bull markets often correct through sector rotation, where leadership changes every few months.

Check my new book: The 5 Secrets To Highly Profitable Swing Trading

10,000 Foot View

I bet you don’t look very often at charts, where one candle represents one year. Neither do I. Sometimes, it is interesting to take a step back and look at the big picture. Here are the annual charts of some of the major stock indexes, sectors and equities:

Screen Shot 2014-11-19 at 5.06.49 AM

Screen Shot 2014-11-19 at 5.07.31 AM

Screen Shot 2014-11-19 at 5.08.04 AM

Screen Shot 2014-11-19 at 5.08.44 AM

Screen Shot 2014-11-19 at 5.10.05 AM

Screen Shot 2014-11-19 at 5.10.28 AM

Screen Shot 2014-11-19 at 5.11.21 AM

Screen Shot 2014-11-19 at 5.11.49 AM

Screen Shot 2014-11-19 at 5.13.29 AM

Screen Shot 2014-11-19 at 5.13.58 AM

All Eyes On India


eem

Emerging markets have been a mess this year. Out of the four BRIC markets, India has been the only one that has outperformed the S & P 500 so far this year. $INDY, which represents the top 50 Indian companies by market capitalization,  continues to consolidate near multi-year highs.

chart


How does one take advantage of the relative strength in India? Look no further than the so called “Priceline of India”. Makemytrip is the biggest online travel agency in India and its stock is setting up for a potential breakout. $MMYT is already a billion dollar company, but it is still relatively small player when compared to industry juggernauts like Chinese $CTRP (8.5Bn mkt cap), Expedia (11Bn mkt. cap) and Priceline (over 60Bn mkt. cap). $MMYT could be owned here near $30 with about $2 stop. It has the potential to test its 52wk highs near 36.

chart-1
 

Check my new book: The 5 Secrets To Highly Profitable Swing Trading