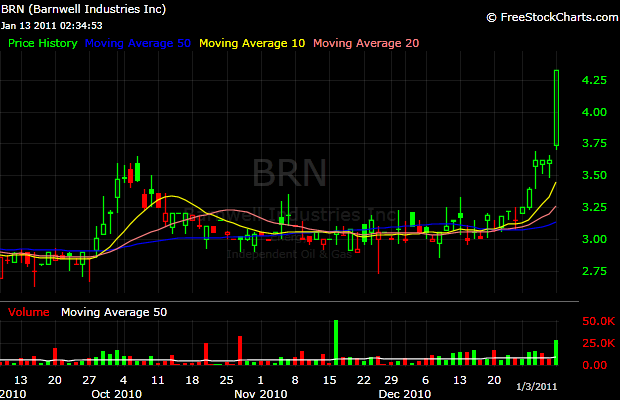
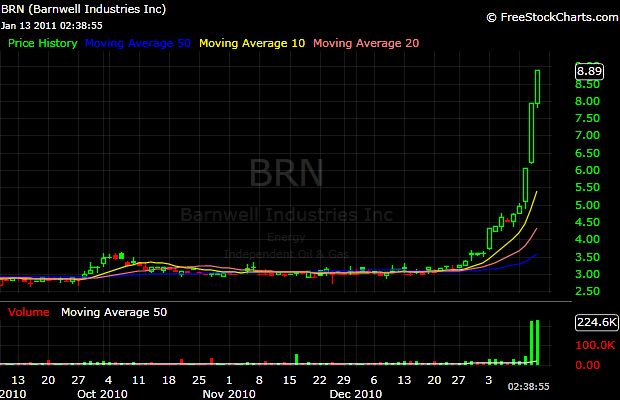
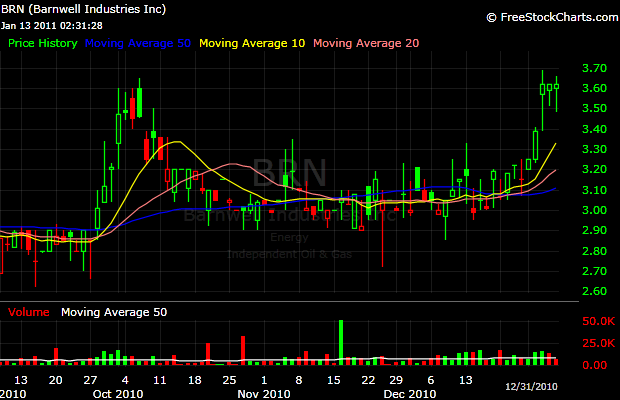
Only 9 trading days into 2011, there is a stock that is already up 150% ytd. – $BRN. I don’t know much about the company’s underlying business and my thoughts in this post will be focused purely on the technical characteristics of the move.
Shares outstanding = 8.3mm
Float = 4.5mm
Current market cap = $74mm
There is a high negative correlation between the size of the float and the potential for a big move up or down as the smaller the float, the tighter the potential supply and demand. The smaller the market cap, the more volatile one stock could be.
1) A high volume (in relative terms) 5%+ move above a long-term range. Average daily volume = 8k (no one pays attention as the stock is considered illiquid):

3) A Humongous Breakout (the stock finally appears on the radar of some traders, but at this point it looks overextended; therefore it is ignored)

4) Continues to slowly move up

5) Another monstrous range expansion (on a side note, here $BRN was featured in the daily Chart.ly TKO email as the best performing stock ytd)

6) The move up continues. For how long, it is anyone’s guess.

