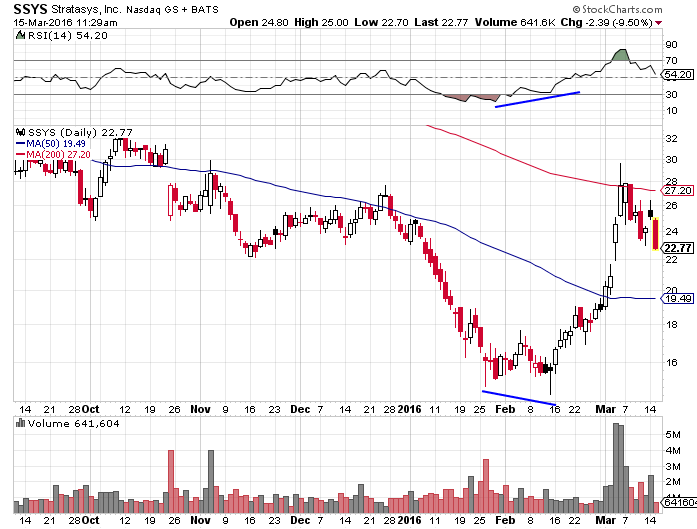
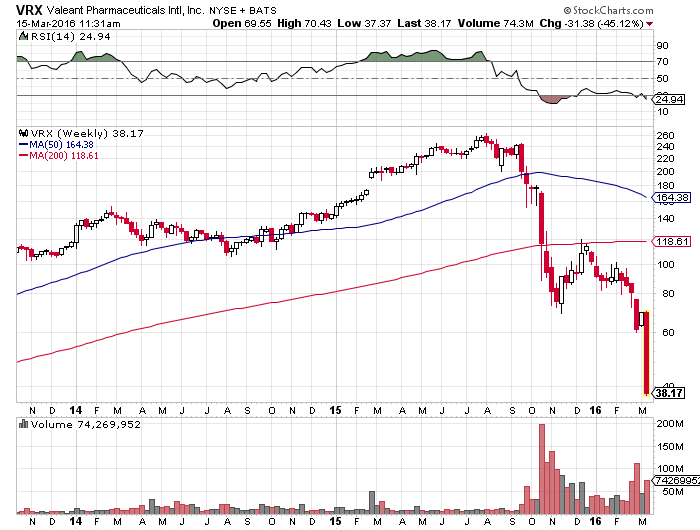
VRX is down another 40% this morning, extending its drawdown to 85% from its 52-week high reached last summer. I am not familiar with VRX’s fundamentals and I am not going to argue about them. My point is strictly about technicals and sentiment.
Over the past few weeks, many have been pointing out to a positive momentum divergence in VRX – its price made new price lows in early March while its RSI didn’t. For some this is enough to put it on their watch list and wait for some signs of strength before entering on the long side. While it is true that momentum often leads price, price is the only thing that actually pays us. The delay between a positive momentum divergence in individual stocks and price reversal could be substantial or longer than most people could remain solvent and sane. Plus, this signal doesn’t always work. No indicator does.
My friend Frank Zorrilla made a really interesting observation this morning:
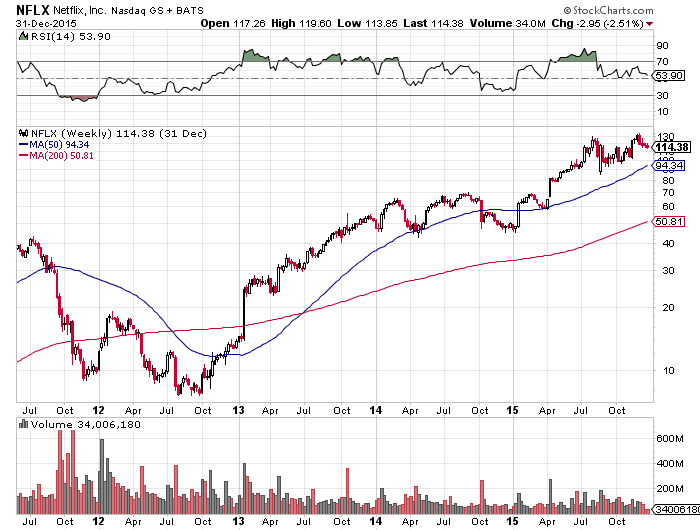
$VRX is the reason why you don’t bottom fish, $NFLX back in 2012 is why you do…that settles it…
— Frank Zorrilla (@ZorTrades) Mar. 15 at 07:35 AM
NFLX also lost 80% of its market cap in 2011/2012. The difference is that then it spent multiple weeks in a tight, low-volume range, which is the ultimate sign of neglect. Then, it made a new 52-week high in early 2013 and it never looked back. It went up more than 400% in the next 3 years. You didn’t have to bottom fish for NFLX. You could have been “late” and wait for a fresh breakout from a consolidation and still achieved a substantial return. The best performing stocks in any given year are usually the ones that surprise the most. This means that they will often come from a place very few expect – they are likely to be widely neglected before and even after their major high-volume breakout to new 52-week highs.
There is a time and place for each market strategy.
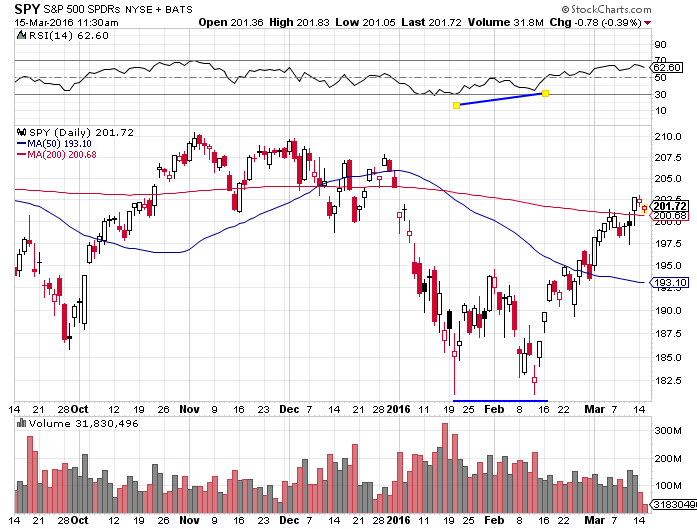
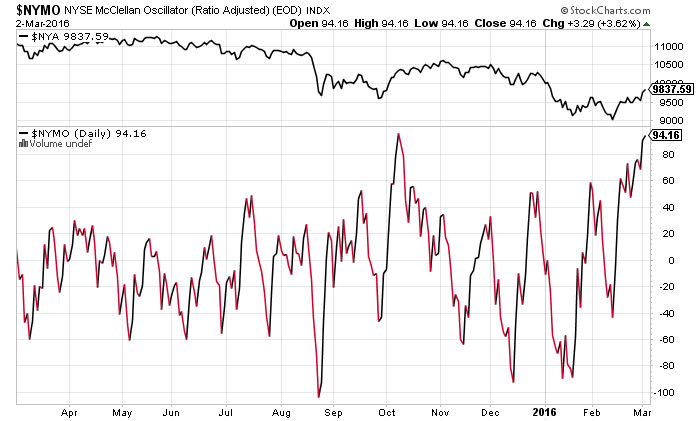
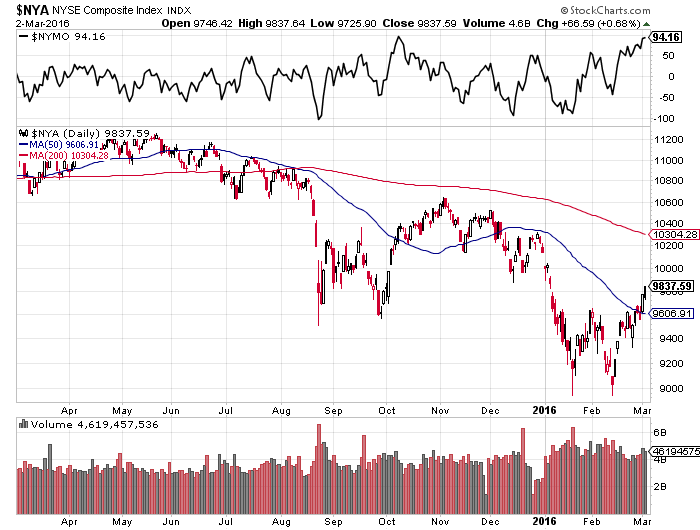
Stocks that make new 52-week lows in a bull market are usually there for a good reason. From my perspective, there’s only one market environment where it is relatively safe to try bottom fishing and the potential reward far outweighs the risk taken. It is during market corrections when the general market tests its momentum lows with some form of breadth divergence. In my book CRASH, I describe the five stages that a typical market correction goes through:
- The Guillotine Stage – fast sharp decline that last 1-3 weeks and leads to a 5-10% loss in major indexes and leads to extremely oversold market breadth readings. Volatility spikes through the roof during this stage and it stays there. Indexes close below their 200-day moving average.
- Short-term bounce that gains back 30-50% of the sharp decline in stage one. Such bounces often find resistance and reverse lower at declining 10, 20, 50 or 200-day moving averages.
- Choppy market environment, that gradually whipsaws both bulls and bears as market often changes directions and daily price ranges are extremely wide. During this stage, fear is gradually replaced by apathy and lack of interest in the market.
- A retest of the momentum low achieved in stage 1. There is usually some type of breadth divergence – indexes are piercing below their momentum lows but with improved internals – there’s a smaller percentage of stocks making new 20-day lows than in stage 1. If indexes cannot sustain bounce after this retest, we are probably in the midst of a bear market or a lot longer correction, at least.
- Recovery – correlations are very high at this stage. Indexes quickly reach overbought levels and stay there for a long time. Those who wait for a pullback, miss the boat.
Most stocks tend to top individually, but they bottom together as a group. Fishing for beaten down stocks that are down 80% or even 90% from their 52-week highs only makes sense in stage four of a typical market correction. Here’s a recent example.