Best Performing Stocks YTD – Part 2

The best performing stocks in any given year are usually the ones that surprise the most frequently and by the highest margin. Powerful price trends are sustained by a sequence of catalysts. Under the surface, all catalysts are earnings related.

In the previous post, I pointed out that a big number of the best performing stocks are neglected price-wise and volume-wise in the beginning of their trend. Most market participants miss the first stage of the move by focusing only on highly liquid stocks, without understanding that liquidity often follows price when there is a catalyst involved.

There are different type of buyers at the various stages in the price cycle of one stock. Earnings related catalysts (earnings reports, new contract, move in the underlying commodity…) have the potential to change perceptions of value and to start a process of major repricing – the beginning of a new trend or the acceleration of an already existing one. The first buyers believe that their expectations for strong earnings growth will one day materialize into strong price growth. This is why they are not afraid to buy low liquid stocks.

After the initial run, a typical stock will consolidate and form what many call a bullish flag or wedge. This is the stage when this stock will be caught by the scans of technical traders and they will get involved, further exacerbating the liquidity. Technical traders assume that someone knows something about the company and this is why the underlying stock is accumulated. They might not be right, but when enough market participants act on their beliefs, their expectations turn into a self-fulfilling prophecy and the stock breaks out from the bullish pattern, further attracting fresh capital. At some point, the enthusiasm of the buyers will fade out. This is the make or break moment for the stock. If another fundamental catalyst does not appear, the trend is short-lived and the price turns south. This is why in the beginning of this post, I highlighted that strong price trends are sustained by a sequence of catalysts.

In the middle of their price trend, most of the future best performing stocks look overextended. Most market participants will ignore such stocks because they are up “too much, too fast”. In capital markets, what feels irrational is often the right thing to do.

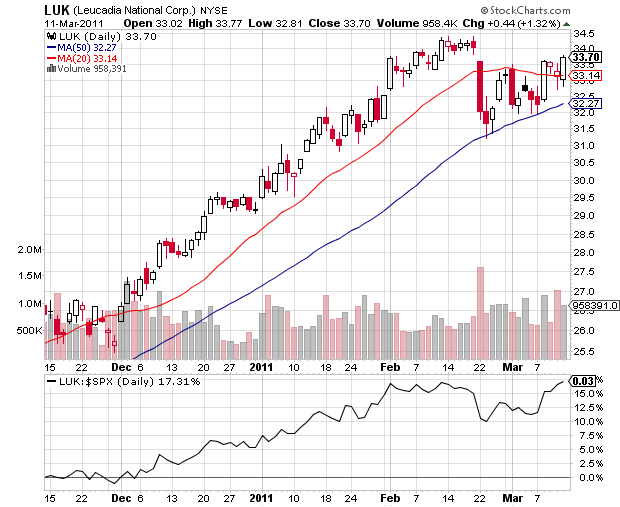
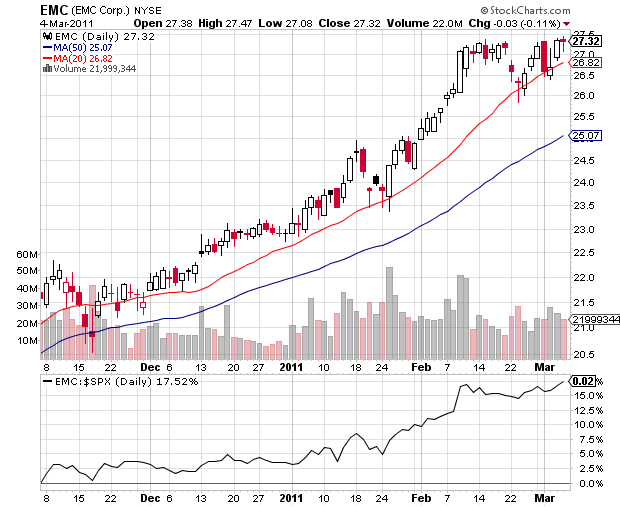
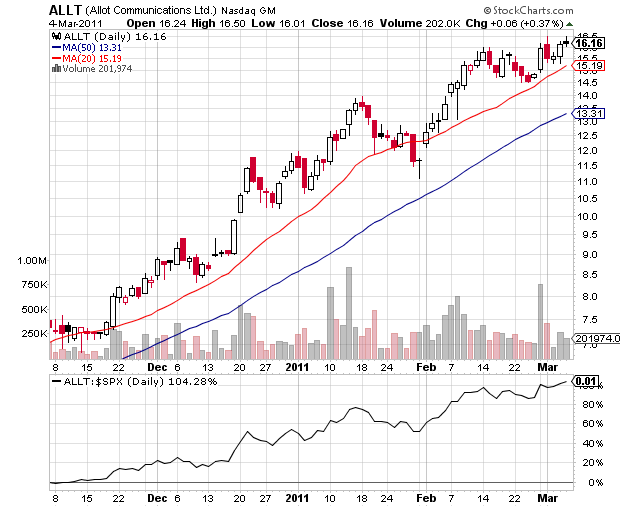
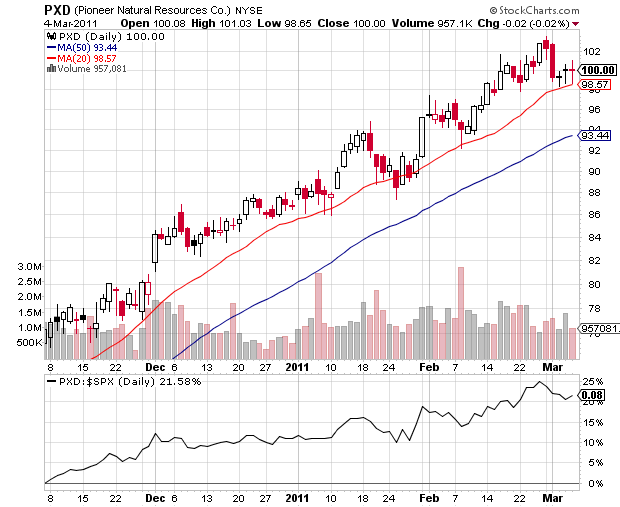
Let’s take a look at the weekly charts of another five stocks that shined during the year:

Best Performing Stocks YTD – Part 1

It is this time of the year again, when we could look back at the best performing stocks YTD and try to reveal the catalysts behind the biggest moves. I do this on a regular basis, using different time frames. There is no better way to learn about the underlying forces that create and sustain powerful price trends. Based on my findings, I created screens that help me to spot future price winners in the making.

As of tonight, there are 166 stocks that more than doubled ytd and are currently trading more than 100k shares daily. Let’s take a look at the weekly charts of the five best performing stocks:

Today we will examine the trends just from a technical perspective. In the following posts, we will dive deeper and look at the catalysts and the psychology behind the price moves.

What were some of the common features between the above mentioned stocks, before they went to make their monstrous moves?

1) Sudden range expansion (in the example of $TORM, from 50 cents weekly range to $3.50 weekly range)

2) Volume expansion (in the case of $TORM, from 5000 traded shares per week to 200k, a 20 fold increase). As the price moves higher, liquidity improves.

3) The five stocks were below $5 in January. Under $5 stocks are under the radar and often neglected volumewise.

What were the most obvious common features between the five stocks in the middle of their moves?

Well, all stocks that appreciate more than 300% ytd, are up only a 100% at some point in the year. Not every 100% move will turn into a 300% move, but relative strength plays a huge role in revealing the best performing stocks ytd. The strong get stronger.

How Technical Setups Work

It is not a secret that many of the swing traders look for essentially the same type of setup: a few days to a few months of a price uptrend, followed by tight range consolidation  and a breakout from this consolidation. How is it possible that everyone is looking for the same patterns, everyone is trading the same stocks and these patterns continues to work? (at least for some of the market participants)

Let’s for a moment forget about all the fundamental catalysts that impact market participants’ perceptions and therefore action and focus only on the technical aspect of the setup. What happens for this bullish setup to work? There is an uptrend and then the stock trades in the upper range of this uptrend, revealing institutional interest. Institutions are not willing to buy the breakout just yet, but they are quietly accumulating every little dip, essentially supporting the stock above certain price level. Such stocks appear on the screens of many swing traders.

Which are the different groups of market participants that make the existence of this setup possible:

1) Some traders will enter in anticipation of a breakout. The logic is simple. If the stock breaks out and runs quickly, I might not be able to get in a good risk/reward trade. I should get in now. If I am wrong, I will get stopped below the lower range of the consolidation. If I am right, the potential reward will be 3-4 times bigger. I could be right in only 40% of my trades and still end up with a profitable year. It makes perfect sense. The drawback of this approach is that you don’t know when and if the breakout is going to happen, essentially locking your capital in an unproductive vehicle. Also, in many cases, the stock will dip slightly below the obvious support level only to shake out some weak hands and it will quickly recover back. So what do you do in such situation? Not following your stop loss rules forms bad habits.

2) As the stock breaks from its consolidation, a new group of market participants enter. Robots and humans act on the signal and pile in. If the demand overwhelms the supply, the stock will quickly soar and each point higher will attract new fresh capital. The drawback of this approach is that you might not be quick enough to enter when the breakout is happening. Also the breakout might be a fakeout, as the stock quickly reverses back to the previous range. It is not ready to breakout just yet.

3) A third group of participants opens positions only after the stock is up 3 – 5 % above the breakout level. Such percentage gain is considered a reliable signal that the stock is moving from the accumulation into the mark-up mode. The drawback of this approach is that you enter relatively far from the consolidation, which means that your stop is further away and therefore your position is smaller. The new capital boosts the volume and sends the price even higher

4) Short-sellers finally give up on the stock and start to cover, further fueling the uptrend and providing liquidity for the early buyers. Market participants that accumulated in the base of the stock take full advantage of the situation and gradually distribute their shares at this level. At some point, the supply overwhelms the demand and the stock turns parabolic.

If everyone is looking and trading the same stocks, why so few people are actually consistently profitable?

Two main reasons:

– All setups have different success rate in the different stages of the market. Those who understand market structure, know that they should stay on the sidelines when the current market environment is not favorable for their market approach. Sit and wait patiently. Most market participants are looking for instant gratification and a 100% success rate. When they lose money a few times in a row, they just jump on the next “big” thing; never spending enough time to specialize in one particular setup.

-Most market participants are not willing to cut their losses quickly when a trade goes against them; If there was only one thing you should learn about consistent profitability, it is to cut your losses short. I know, it sounds overly simplistic, but it is true. It is easy to comprehend the concept, it is so hard to apply it in reality. The psychological reasons behind this phenomenon are deeply ingrained in the human brain and I will address them in another post.