It is particularly shocking that people do what is called “stress tests” by taking the worst possible past deviation as an anchor event to project the worst possible future deviation, not thinking that they would have failed to account for such deviation had they used the same method on the day before that past anchor event.
Author: Ivanhoff
How our implicit memory affects decision making
Implicit memory is comprised of unconscious emotional patterns of relating to ourselves and others. It’s the kind of memory you access without thinking. It’s what makes you feel characteristically you.
These are the types of behavioural patterns laid down implicitly in the brain:
How do you feel about yourself?
Are you good at self-care? Do you accept all aspects of your personality? Or do you tend to deny yourself, or verbally beat yourself up?
How are you with others?
Do you naturally gravitate towards others and enjoy their company? Or do you prefer being on your own?
Implicit memory guides our behavior automatically, without thought or effort. You can think of implicit memory as a set of instructions or procedures encoded in the brain. However, a procedure can’t easily be described in words or contained in images. These procedures are nonconscious and nonverbal.
Implicit memory starts early
For the first 18 months of our lives the implicit memory system is online establishing the basis of our character. Explicit memory, the kind of memory we can consciously recall (“I remember the time when I….”), doesn’t come fully online until much later.
After an infant learns to identify her mother’s face, voice, touch and smell, she learns how to communicate her needs to this “person”, all based on trial and error. Successes and failures are recorded, with particular attention given to memories of interactions with caregivers, and gradually a patterned and predictable way of responding to the world evolves.
This kind of memory is necessarily implicit because the newborn has no conceptual or verbal ability and must depend on its inborn capacity to learn what it needs quickly and nonconsciously, in an environment where survival itself depends on emotional connection.
Implicit memory is procedural. This means implicit memory is difficult to change. For instance, you just can’t tell yourself, “Don’t be stubborn” and hope this will change you permanently. This is like the left brain telling the right brain what to do. It is not going to happen this way. This is not how our brain works. It takes hundreds of hours of deliberate practice and constant repetition to turn a desired behavior into a habit.
Procedural memory is the basis for our character.
The procedural memory system stores the instructions for our habitual responses. In other words it patterns how we do things. More profoundly, it is about who we are.1
In other words, procedural memory is the basis of our character, those aspects of ourselves that make us unique.
When we learn a behaviour or an emotional response it becomes part of our procedural memory. Once it’s been “programmed” into the procedural memory system we don’t need to decide how to respond to a specific situation because it has now become automatic–after all, that’s the whole point.
You see these “overlearned” patterns are the “behind the scenes” kind of memory that frees up our attention for more important tasks.
For instance, I can drive my car and carry on a conversation at the same time. The ‘driving’ behaviour is encoded in procedural memory. Since I’ve overlearned the skills needed for driving I don’t need to be conscious of every detail in order to keep my car on the road.
When procedural memory kicks in, it’s like being “on autopilot”.
Procedural memory is important in counseling because many of our emotions and behaviours that accompany them occur ‘automatically’. In order to change a behaviour we need to bring it into conscious awareness and ‘out of procedure’.
Procedures take a while to learn but they make life a lot easier. Can you imagine for instance if we had to sound out every letter of every word in order to read? Reading becomes a procedural skill.
An important feature of procedural memory is that it tends to persist; it’s resistant to change. This is a good thing because you don’t want to have to keep re-learning behaviours. But this also means that you can’t change a procedure, unless and until you pay attention to how and when it operates. And procedural patterns take a while to unlearn.
Let’s say you like to play tennis; you were self-taught and have played for years. You decide to take some lessons. The instructor shows you how to swing the racquet more effectively.
But you soon discover that you just can’t just tell yourself to swing it differently. The old pathways interfere with the new ones. It’s hard to interrupt a well-established procedure.
In fact, those original neural pathways, though weakened, will always be there, for we currently have no reason to think that they will deteriorate. Under conditions resembling the initial circumstances in which they were laid down they may even be reactivated!
But the good news is that the new, regulated pathways will eventually override the old ones.
Once you unconsciously trigger a procedure, which could be any routine task, it’s difficult to stop yourself from completing it. That is, it’s difficult to interrupt the procedure.
Want to know why you repeat the same pattern in relationships even though these strategies clearly don’t work? You’re not alone. Benjamin Franklin once observed that “the definition of “insanity” is doing the same thing over and over again, but expecting different results”.
Once you understand how procedural memory works you’ll have a better handle on why you repeat ineffective, even self-defeating, behaviours.
Once a procedure is initiated it acquires a forward momentum that is uncomfortable to stop. This is the source of the desire to continue the procedure. Procedural memory dances with our cortex which can always come up with a “rational” explanation or justification for our automatic behaviors.
It takes many repetitions of a behaviour or an emotional response before it’s ingrained, and once that procedure is established it’s difficult to change.
For the same reason, we can’t change our way of relating (i.e. implicit memory) simply by telling ourselves to feel differently. It requires special conditions for the change to occur.
The Volatile Decade
In January 2000 market participants were willing to pay about 146 for one share of SPY. 10 years later, the bid is slightly above 112 – approximately 22% discount. The dividends paid over the last decade (between 1 and 3% annually) offset the bigger portion of the capital loss, but are not nearly enough to compensate for the taken risk and the diminished purchasing power of the US Dollar. At the beginning of the decade $1 was essentially equal to €1; 1.45 CAD, 105 JPY, 1.57 CHF, Today $1 can buy €0.70, 1.04 CAD, 92 JPY, 1.04 CHF. As the debt level and budget deficit of one country rise faster than its GDP, it is natural for investors to be willing to pay less and less for its currency.
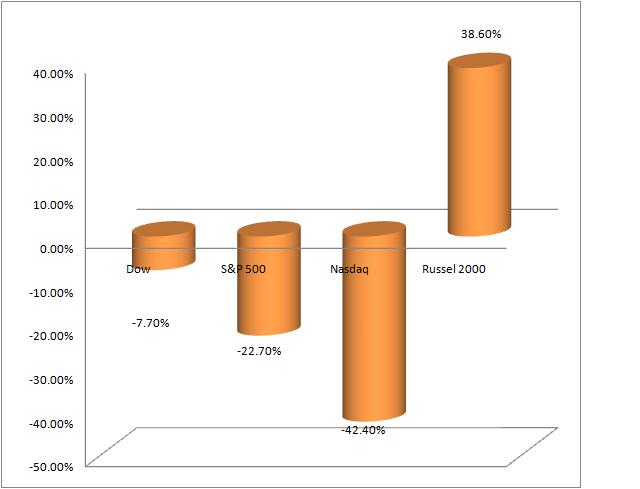
Small caps, measured by Russell 2000, outperformed all other benchmark indexes significantly. As your investing horizon becomes longer, the probability of a portfolio of small cap stocks to outperform S&P 500, increases. Small caps are considered more sensitive to changes in the economy. They tend to outperform in periods of higher nominal GDP growth (derived from productivity and inflation) and underperform in deflationary periods.
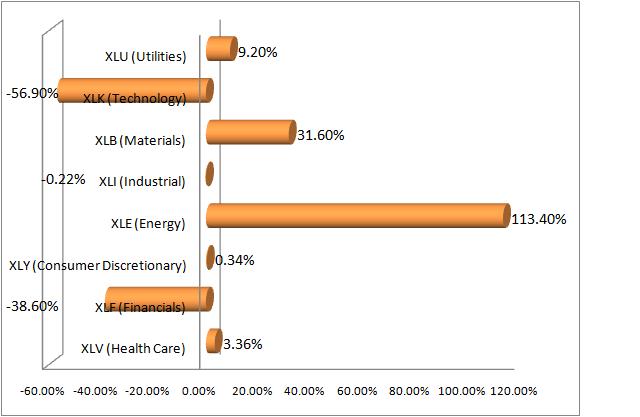
Not all sectors were created equal. Low interest rates, weak dollar and robust growth of the Chinese economy helped Energy and Basic Material Stocks to outperform substantially. History rhymes itself. Commodities provided outstanding returns during the 70s and early 80s. The next 15 years they were among the worst performers, only to start shining again in the beginning of the 21 century.
SPDRS components performance from 2000 to 2009

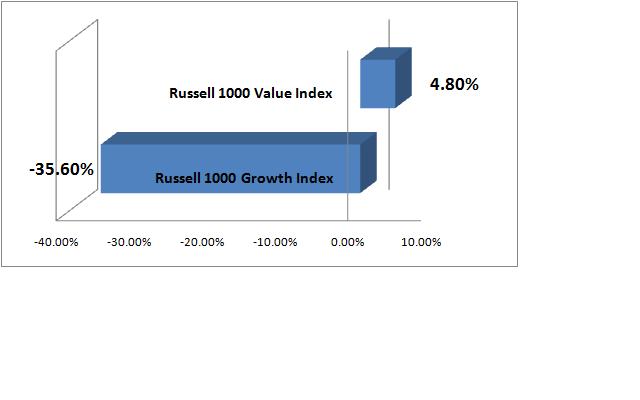
Value stocks outperformed growth stocks in terms of capital gains and in terms of dividends (paying between 2.5 and 4 times bigger dividends annually)
Value vs Growth from 2000 to 2009 (excluding dividends)
Growth stocks tend to outperform during periods of economic pessimism and deflationary pressures. The nominal earnings growth is scarce and the few companies that manage to grow, get all the investors’ attention and money. Value stocks tend to do better in periods of economic optimism, inflationary pressures and abundance of nominal earnings growth. The stocks that are growing nominal earnings are so many that growth itself is not a sufficient indicator for future outperformance. In such periods, in addition to impressive growth characteristics, investors will also be looking for alluring valuations.
Nominal earnings’ growth of a company is a derivative of three functions:
1) An increase in output. More units are sold without having to accept lower margin. A company sells more products/services to its current customers or it grows its customers’ base.
2) Inflation. It is sector specific and it has positive effect on a company’s bottom line if the price of its output is rising faster than the price of its input. The reverse effect happens, if the input costs rise, but a company is not able to transfer that increase to its customers, which leads to margin squeeze.
3) Productivity: a company is able to create one unit (good or service) cheaper due to new technology.
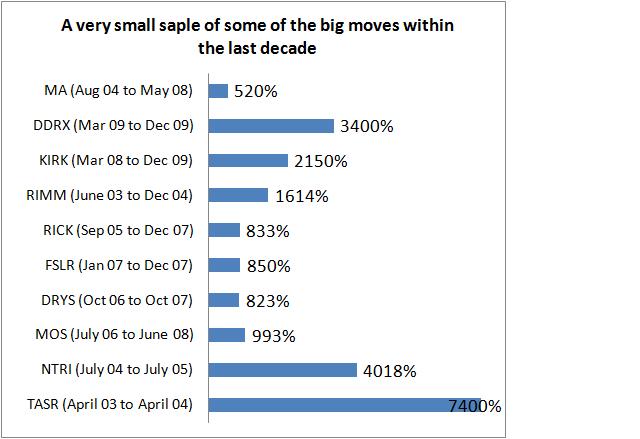
As an asset class, stocks clearly underperformed during the last decade. Comparing prices at the beginning of the decade with prices at the end of the decade is superficial and it doesn’t reveal the big picture. The first 10 years of 21st century were the most volatile ever recorded in the financial history of the world. Despite S&P 500 negative growth, equities actually offered thousands of opportunities for smart investors. Gigantic wealths were created in the stock market, gigantic wealths were destroyed.
If I learned something during the past decade, it is that sooner or later all great trends end due to two simple reasons:
1) At some point Wall Street printing press manages to catch up with the demand for stocks that the public desire to own. Stocks do not only represent a share in a company. They are also the product that Wall Street manufactures, markets and sells. The capacity of Wall Street printing machine is unlimited.
2) At some point investors’ expectations start to rise faster that the company’s ability to grow earnings and this marks the beginning of the end.
In terms of opportunities, the next decade will not be any different. There will be booms, there will be busts and there will be plenty of them.


