The big 5% Wednesday was followed by a strong intra-day pullback but a strong close. In the end, all major market averages finished near the highs of their daily range.
Overall, today was a big win for the bulls. There are more stocks setting up and looking constructively. With all positives in mind, it makes sense to continue to be cautious and to operate with the thesis that this is just a rally within an ongoing bear market, which means stay nimble and don’t hesitate to take partial profits on strength, often. From a technical perspective, SPY has room to run to 260 before it encounters a serious resistance.
All charts on Momentum Monday are powered by MarketSmith
The stock market has been in a free fall as of late. Last week, we saw a major acceleration in the selloff. Ever since the S&P 500 lost 2600, the selling has been relentless. Market breadth has reached deeply oversold levels that are seen very rarely. Sentiment is getting more bearish by the minute. These conditions have historically led to two outcomes:
A 10-15% counter-trend bounce;
Flash crash.
The first is more likely than the second, but the second is not impossible.
In today’s show, we go over the price action in SPY, QQQ, AAPL, HYG, USO, AMZN, FB, among many others.
All charts in this post are powered by MarketSmith
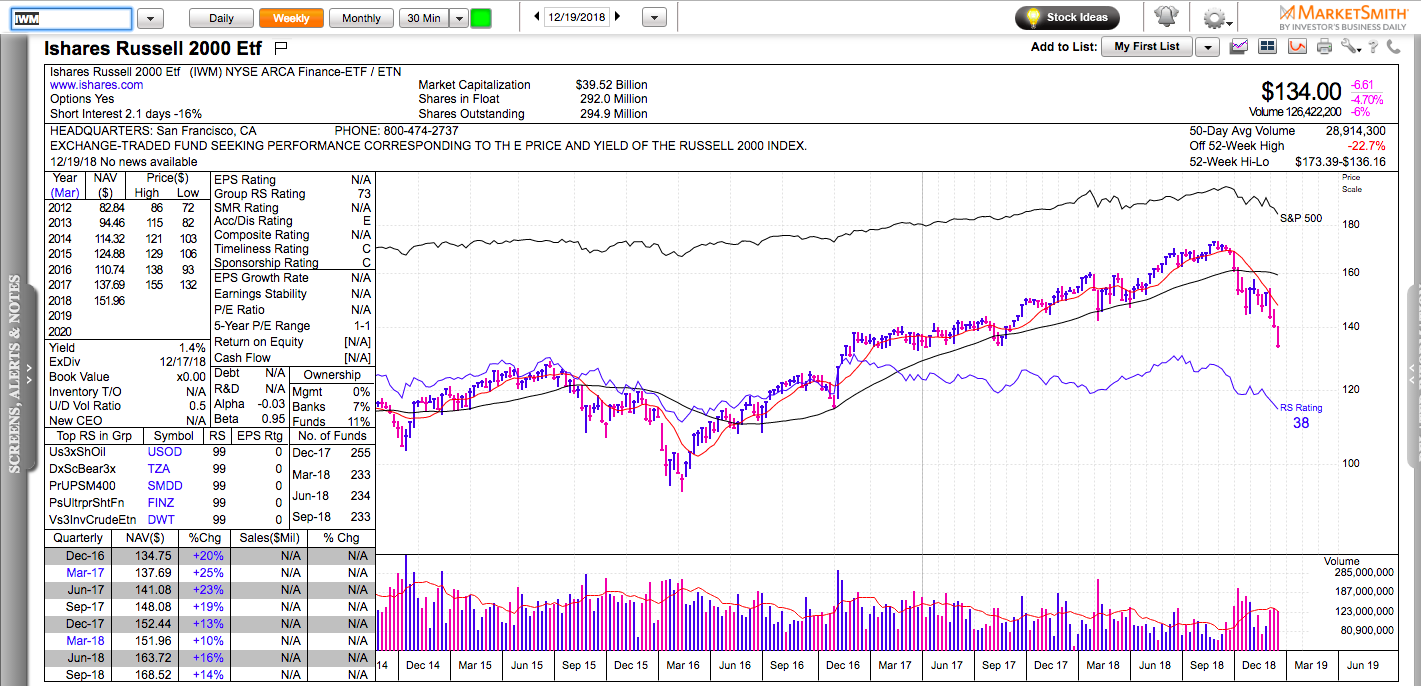
The small-cap index, Russell 2000 (IWM) has already erased its entire 2017 gain and it is back to potential technical support in the low 130s.
(click anywhere on the charts to expand them)
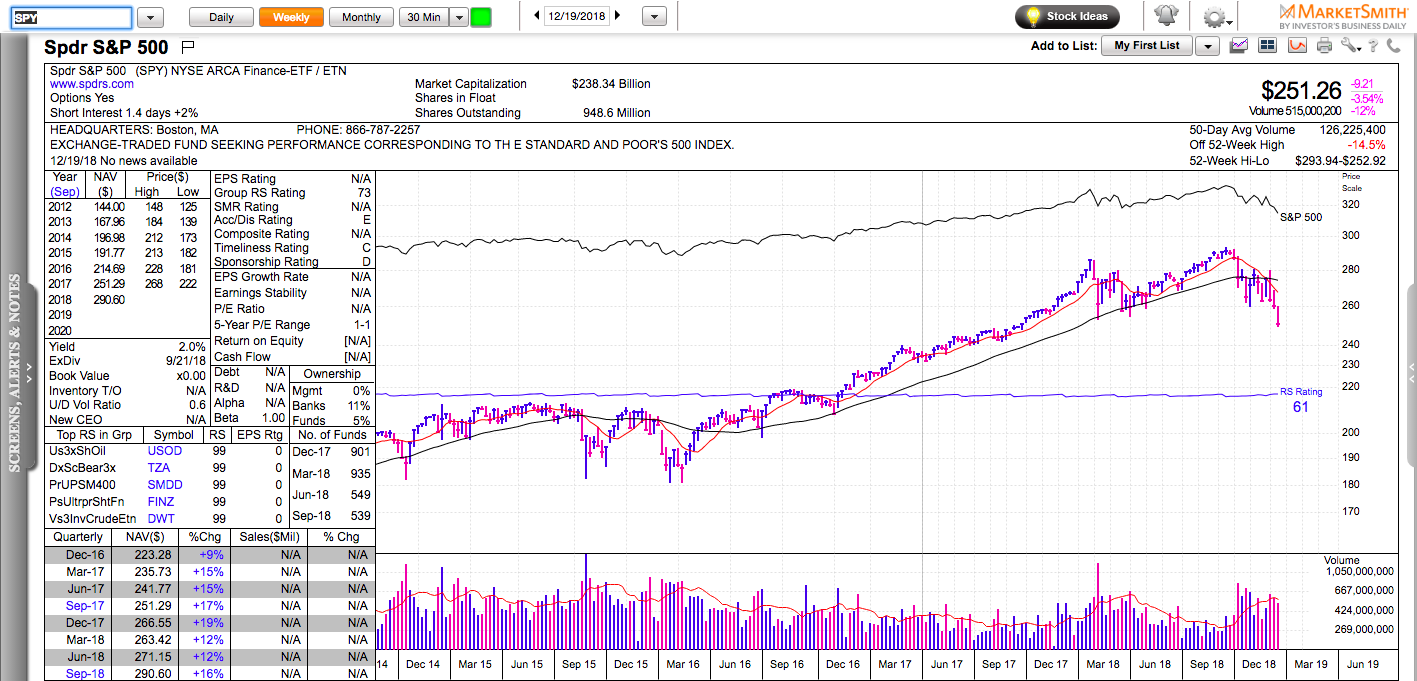
The S&P 500, pierced its year-to-date lows and it is trading near potential technical support at 250.
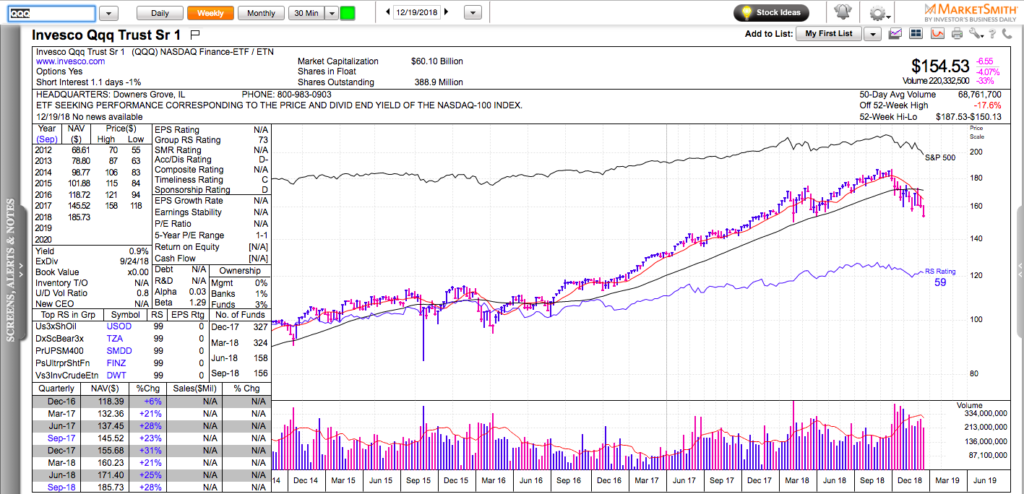
The Nasdaq 100 is now negative for the year and 17% below its 52-week highs. It’s within a striking distance from 150, which is its year-to-date low.
In the meantime, market breadth readings have reached extremely oversold readings:
– only 4% of the S&P 500 stocks are above their 5-day moving average;
– only 1.4% of the S&P 500 stocks are above their 20-day moving average;
– only 11.3% of the S&P 500 stocks are above their 50-day moving average;
– only 20% of the S&P 500 stocks are above their 200-day moving average – a level not seen since January 2016.
The major U.S. stock indexes are at sentiment and technical levels that will either lead to a 4-5% short-term bounce or to a flash crash (quick 5-10% swoosh lower followed by a bounce that erases that entire swoosh).
Correlations are extremely high during market corrections and the first stages of a market bounce. Stock picking is not as important in this such an environment, because stocks recover and crash together. This is why many active traders prefer to use leveraged ETFs like TQQQ to play any type of a bounce (TQQQ is 3x long the Nasdaq 100).
Any potential bounce would be in the context of an ongoing bear market, so make sure you have an exit strategy.