It is this time of the year again, when we could look back at the best performing stocks YTD and try to reveal the catalysts behind the biggest moves. I do this on a regular basis, using different time frames. There is no better way to learn about the underlying forces that create and sustain powerful price trends. Based on my findings, I created screens that help me to spot future price winners in the making.
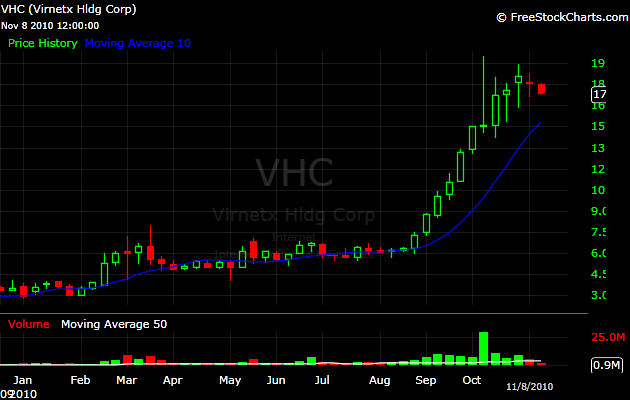
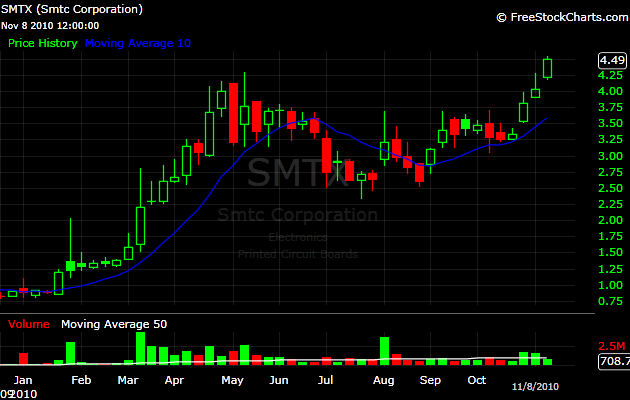
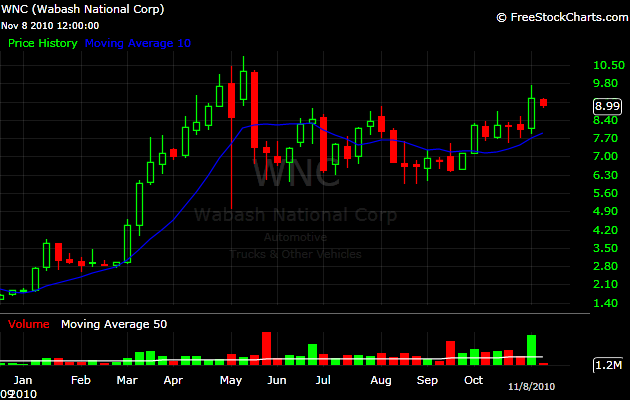
As of tonight, there are 166 stocks that more than doubled ytd and are currently trading more than 100k shares daily. Let’s take a look at the weekly charts of the five best performing stocks:
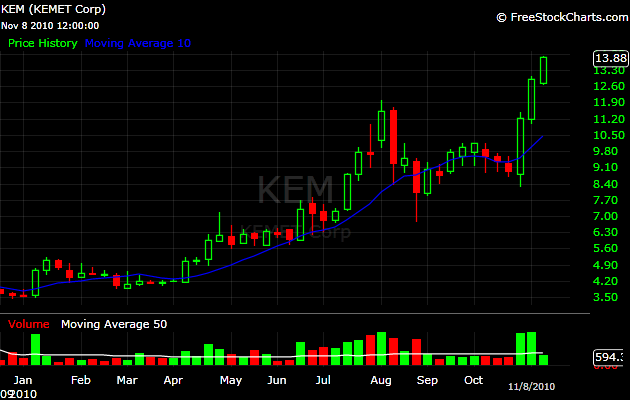
Today we will examine the trends just from a technical perspective. In the following posts, we will dive deeper and look at the catalysts and the psychology behind the price moves.
What were some of the common features between the above mentioned stocks, before they went to make their monstrous moves?
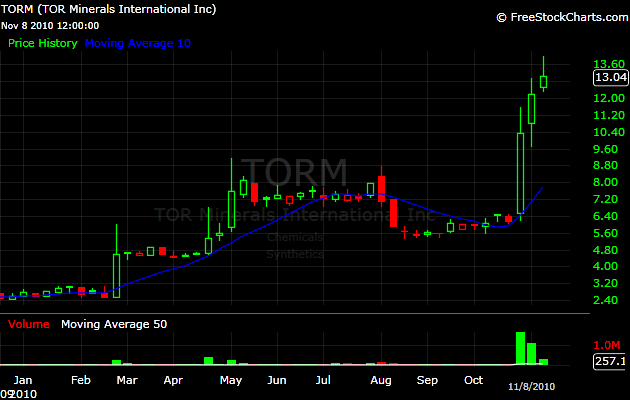
1) Sudden range expansion (in the example of $TORM, from 50 cents weekly range to $3.50 weekly range)
2) Volume expansion (in the case of $TORM, from 5000 traded shares per week to 200k, a 20 fold increase). As the price moves higher, liquidity improves.
3) The five stocks were below $5 in January. Under $5 stocks are under the radar and often neglected volumewise.
What were the most obvious common features between the five stocks in the middle of their moves?
Well, all stocks that appreciate more than 300% ytd, are up only a 100% at some point in the year. Not every 100% move will turn into a 300% move, but relative strength plays a huge role in revealing the best performing stocks ytd. The strong get stronger.
One thought on “Best Performing Stocks YTD – Part 1”
Comments are closed.