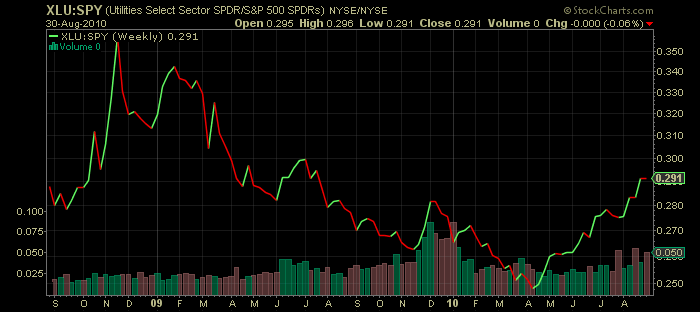
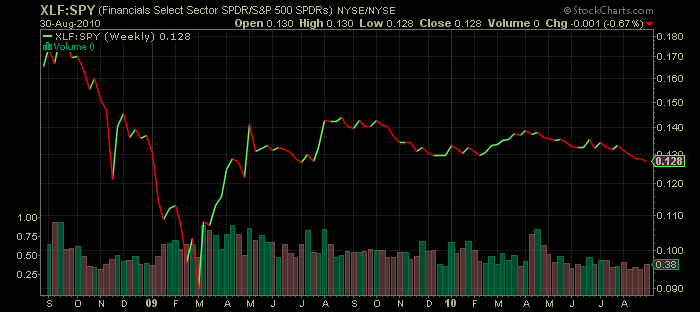
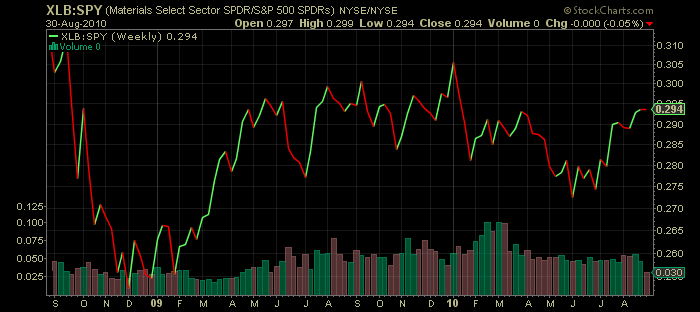
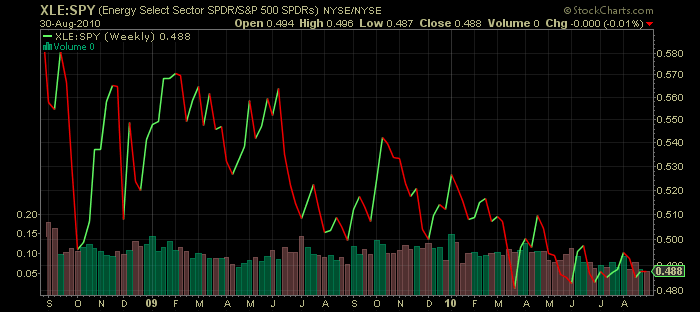
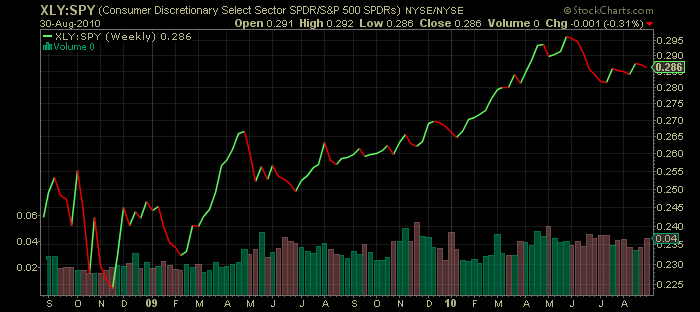
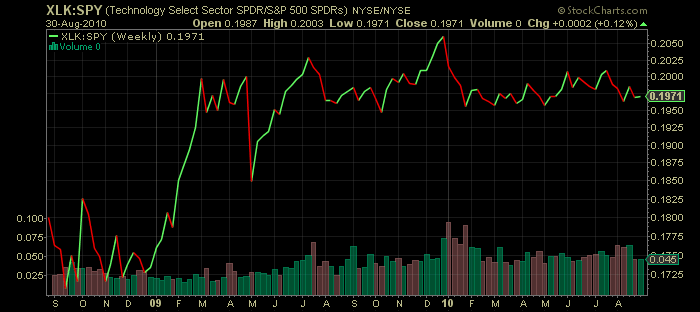
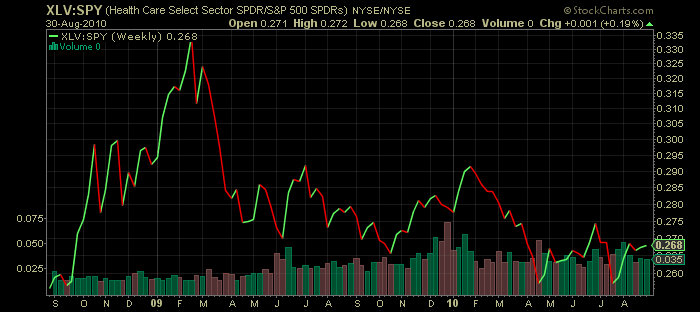
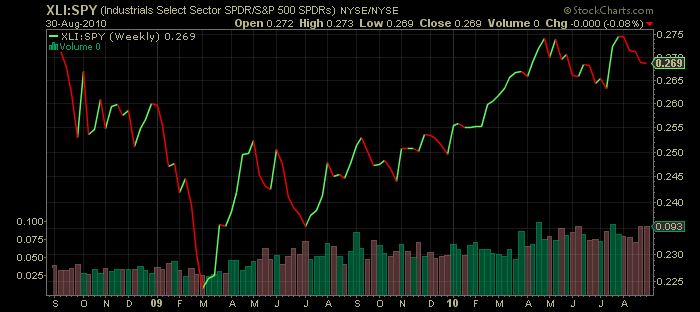
A look at sectors’ RS reveals a lot about the current market sentiment. In the following charts I am comparing each of S&P 500 main components to SPY itself. When the featured sector is outperforming the broad index, the line is rising.
When the market is in defensive mood, utility companies tend to outperform. Due to the nature of their high leverage, utility stocks tend to benefit during periods of declining interest rates’ expectations.
It pays to highlight that since end of July 2010 $XLF has been underperforming the broad index and leading the way down.
Despite the long bond ($TLT) and Japanese Yen ($FXY) making new 52 week highs on a weekly basis, the material sector (led by gold, silver miners and fertilizer companies) has been outperforming the SPY since mid June.
