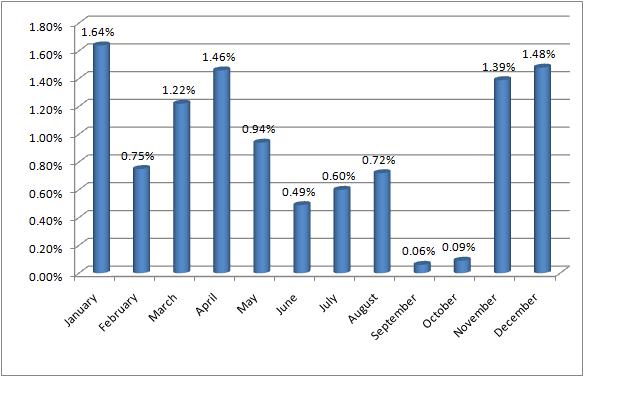
 Source: Plexus Asset Management (based on data from Prof Robert Shiller and I-Net Bridge)
Data is from Jan 1950 to Apr 2009
Prieur du Plessis recently updated a
chart on monthly stock market returns since 1950. It clearly shows that the November
through April periods have on average been superior to the May through October half of
the year.
Prieur du Plessis recently updated a chart on monthly stock market returns since 1950. It clearly shows that the November through April periods have on average been superior to the May through October half of the year.
The difference is quite significant. As Prieur notes, the “good” six-month period shows an average return of 7.9%, while the “bad” six-month period only shows a return of 2.5%.