Is the Stock Market Ready for a Counter-Trend Bounce?

All charts in this post are powered by MarketSmith

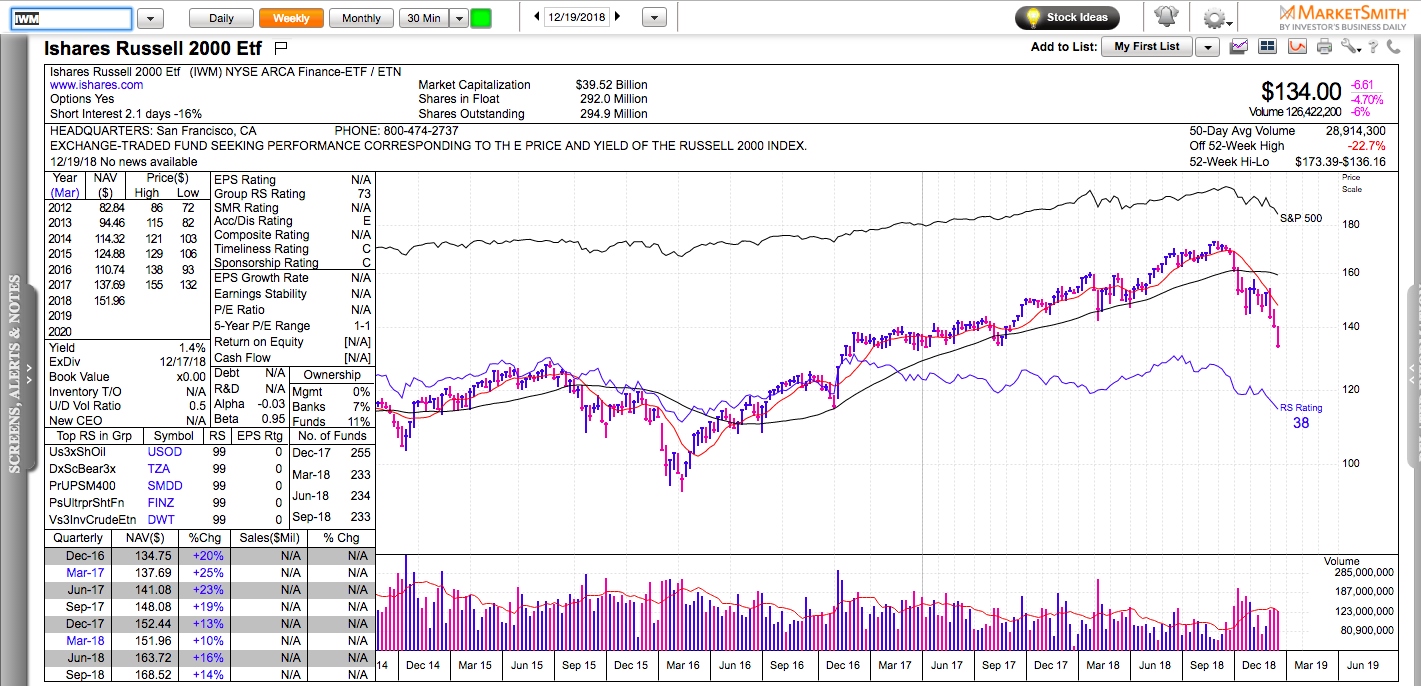
The small-cap index, Russell 2000 (IWM) has already erased its entire 2017 gain and it is back to potential technical support in the low 130s.

(click anywhere on the charts to expand them)

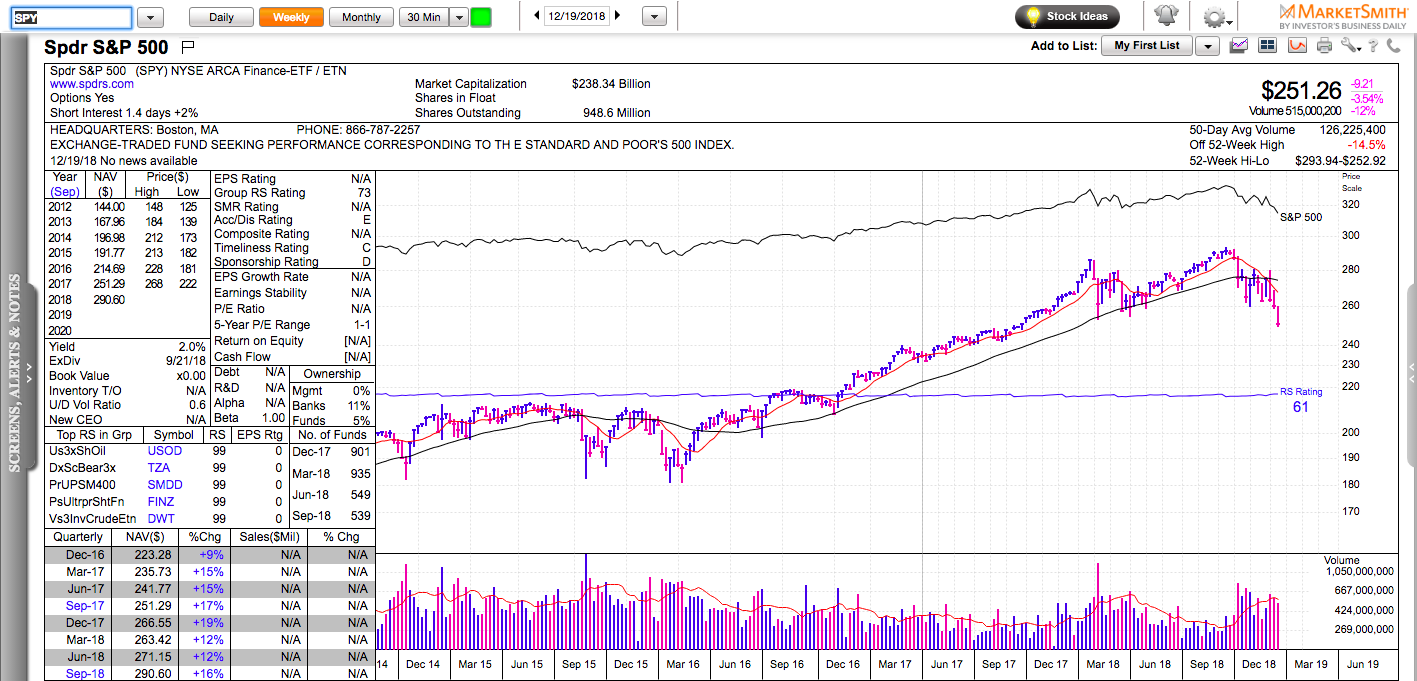
The S&P 500, pierced its year-to-date lows and it is trading near potential technical support at 250.

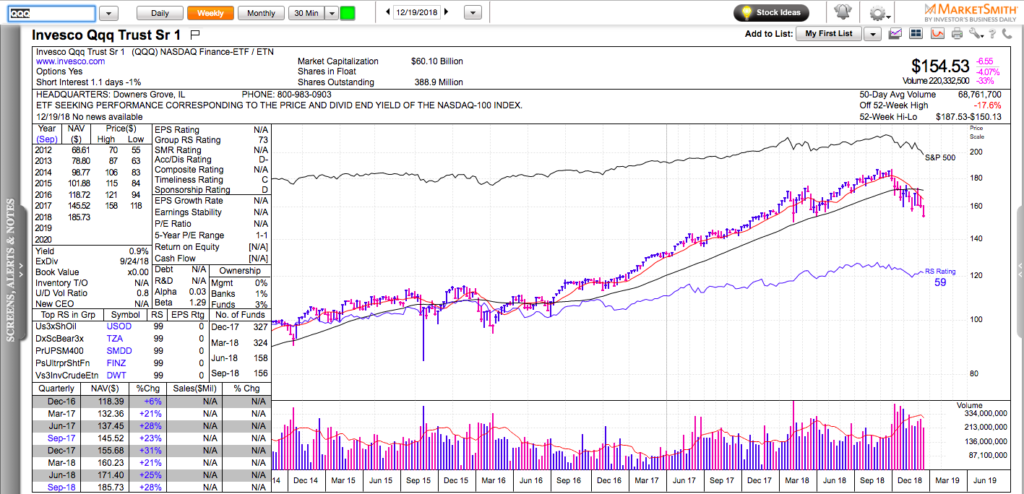
The Nasdaq 100 is now negative for the year and 17% below its 52-week highs. It’s within a striking distance from 150, which is its year-to-date low.

In the meantime, market breadth readings have reached extremely oversold readings:

– only 4% of the S&P 500 stocks are above their 5-day moving average;

– only 1.4% of the S&P 500 stocks are above their 20-day moving average;

– only 11.3% of the S&P 500 stocks are above their 50-day moving average;

– only 20% of the S&P 500 stocks are above their 200-day moving average – a level not seen since January 2016.

The major U.S. stock indexes are at sentiment and technical levels that will either lead to a 4-5% short-term bounce or to a flash crash (quick 5-10% swoosh lower followed by a bounce that erases that entire swoosh).

Correlations are extremely high during market corrections and the first stages of a market bounce. Stock picking is not as important in this such an environment, because stocks recover and crash together. This is why many active traders prefer to use leveraged ETFs like TQQQ to play any type of a bounce (TQQQ is 3x long the Nasdaq 100).

Any potential bounce would be in the context of an ongoing bear market, so make sure you have an exit strategy.

Check out my latest book: Swing Trading with Options – How to trade big trends for big returns.

Momentum Monday – From Failed Moves Come Fast Moves

All charts on Momentum Monday are powered by MarketSmith

The market correction continues with full force and there are no places to hide. The stocks that held the best in the past couple of weeks – enterprise software, are among the hardest hit today. This is what typically happens during forced liquidations when people emotionally decide to get out of everything at any price.

The area near 260 was a major level of support for most of 2018. Today that level was breached on high volume, which typically means that it will now act as a resistance.

People keep saying that some of the most powerful rallies happen in the context of a bear market. It is true, but they are not that easy to time. Some of the important signs of a potential turnaround bounce would include a failed breakdown that leads to a strong close and a gap up on the next day.

In today’s show, we go over the price action in SPY, QQQ, OKTA, ZEN, TWLO, BBY, and some of the defensive stocks.

Check out my latest book: Swing Trading with Options – How to trade big trends for big profits.

62 Stocks Doubled In 2018

All charts in this post are powered by MarketSmith

The market is still in a correction mode but plenty of stocks have had a good year. As of December 15, there are 62 that have more than doubled. If you study their charts, you will notice how the majority of them started their move with a huge-volume breakout to new 50-day highs.

We see quite a few enterprise software names on the list, which only comes to remind us to always pay attention to industry relative strength. It is a lot more sustainable catalyst than just company’s earnings: TWLO, TTD, OKTA, MDB, AYX, COUP. Most of these names continue to be among the strongest stocks currently in the market and are likely to outperform if the general market bounces.

There are also a few cannabis related stocks, which was one of the hottest industries in 2018: TLRY, NBEV.

As usual, the list is dominated by biotech, healthcare and medical research names which account for almost half of the big 2018 winners.

There are a couple turnaround stories in the retail space – CROX and FOSL. There were a lot cannabis-related earlier in the year, but the correction in the last two months has caused a lot of damage to the sector.

While the S&P 500 is down 11.2% from its 52-week highs, the 2018 Doubles are down on average 24.3% from their 52-week highs. Most of them offer multiple great long trading opportunities during their ascent. Now, quite a few of them are setting up on the short side. Some examples to consider: WWE, REGI, SSTI, AMRN,

Check out my latest book: Swing Trading with Options – How to trade big trends for big returns.