When Negative Divergences Are Actually Positive

2014

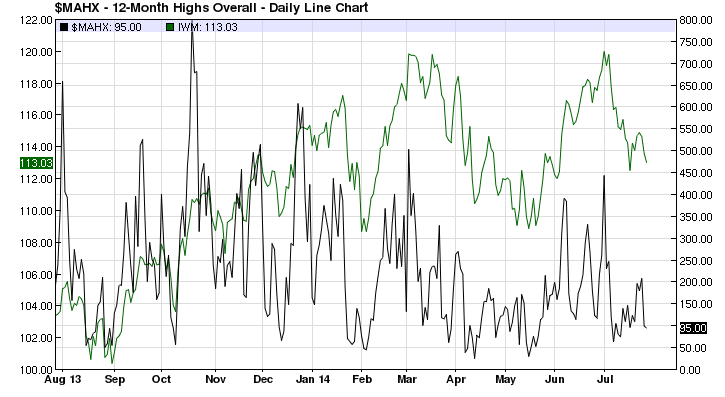
Bull markets climb a wall of worry. Financial pundits’ favorite sport is top-calling. Over the past year, a lot of digital ink has been spilled on the so-called negative divergences. Many have pointed out that the Nasdaq Composite’s new multi-year high is not sustainable, because of the rapidly decreasing number of stocks, making new 52-week highs. This is what all technical books say. Maybe, at some point, this divergence will matter. In the meantime, it won’t hurt if you look at market breadth from a different perspective. Not always, but more often than not, extreme breadth leads to mean-reversion.

Take a look at the chart above, which plots Russell 2000 (in green, small cap index) against the number of total 52-week highs (in black). Any time in the past year, when the black line dropped below 50, there was a stock rally afterwards. Almost any time the black line went above 500, there was a pullback in small caps.

Granted, we should not judge the reliability of one indicator based on just one year of data. Any indicator that works great in a bull market might be totally useless in a bear market.

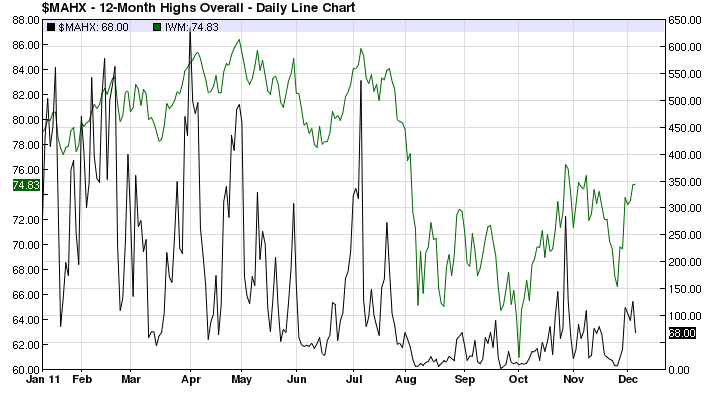
The last big market correction was in 2011, when inside of three months Russell 2000 lost 30%. The number of 52-week highs indicator was irrelevant market timing tool then.

2011

From my perspective, the most practical indicator of market health is the number of great risk/reward long setups and how they act after they break out. Lately, the most appealing setups have been concentrated in emerging markets (mainly China) and large-cap U.S. stocks. It is a market of stocks environment, where there are plenty of opportunities for both bulls and bears.

logo_dark

The Most Visited Web Site In China Is Up 8000% Since Its IPO

Most-Visited-Websites-In-The-World-MAP1

Chinese search engine, Baidu crushed estimates again and its stock is trading at new all-time highs near $220 this morning.

BIDU IPO-ed in 2005 at $27 per share, which is 2.70 on a split-adjusted basis. They had a 10:1 split in 2010. It was considered the hottest IPO of the year. $BIDU gained 350% on its first trading day, finishing at $112.5 (12.25 split-adjusted).

bidu

Over the past decade, BIDU never looked cheap. It was trading at a high P/E multiple all-the way from 2.70 to 220. Don’t be afraid to pay up for high-growth stocks with great potential. In many cases, they are expensive for a reason. Over time, earnings could more than catch up with people’s expectations and justify high valuations.

This is exactly what happened with Baidu. In the quarter before its IPO, it earned $8 million. In its latest 2014 quarter, Baidu earned $571 million.

The market is a voting machine in the short-term and a weighing machine in the long-term. Valuation matters in the end only if earnings don’t catch up, you plan to hold forever and you don’t have an exit strategy. If price gets you in a trade or investment, price should get you out. If you don’t know why you are in the trade, you won’t know when to exit.

logo_dark

Bull Market for Electric Cars

Screen Shot 2014-07-21 at 6.03.01 AM

Are all-electric vehicles the future? The market seems to think so, as both Tesla Motors and its Chinese competitor Kandi Tech have been among the best performing stocks in the past year and a half.

Tesla has finally entered China, which is considered to become a major growth hub for them.

This morning, shares of Tesla are trading lower in pre-market on news that its vehicles won’t qualify for Chinese tax breaks.

If you ask me, the Chinese who could afford Tesla, don’t need tax breaks and it probably won’t affect their decision-making. Tesla is still a luxury vehicle. The more expensive it is, the better it will sell, at least for now.

Besides, take a look at a Tesla and compare it to Kandi:

KD-28E_45_1

imgres