Momentum Monday – Summer Trading

Charts in this post are powered by MarketSmith.

The market environment has certainly changed in the past couple of weeks. We went from a market, where almost all breakout led to a quick 10-30% move to a market with many failed breakouts.

Many Chinese Internet stocks are already down 10-20% from their recent highs and trading near levels of potential support. It will be interesting to see if dip buyers start to step in.

The small-cap biotech etf, XBI tried to break out a couple weeks ago, but the weakness in the general market pulled it back. Nevertheless, we are starting to see some decent long setups in the biotech space.

Some of the tickers we cover: SPY, TSLA, SBUX, XBI, SEDG, SFIX, PETQ, TRUP, etc.

Disclaimer: everything on this show is for informational and educational purposes only. The ideas presented are not recommendations to buy or sell stocks. The material presented here might not take into account your specific investment objectives. I may or I may not own some of the securities mentioned. Consult your investment advisor before acting on any of the information provided here.
Why Are Financial Stocks So Weak?

Stock and ETF charts in this post are powered by MarketSmith.

I keep getting the questions “why are financials so weak” and “shouldn’t bank stocks be outperforming in a rising interest rate environment”?

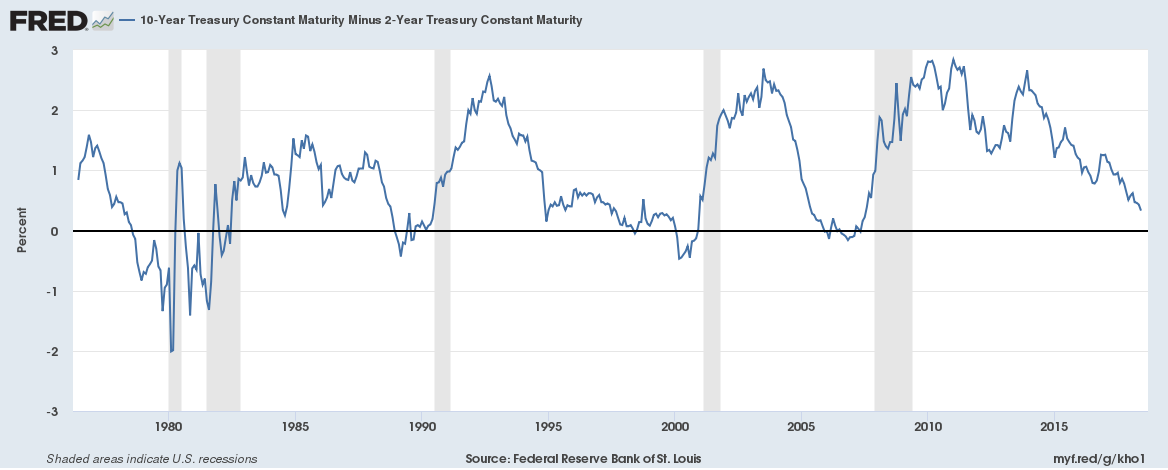
Not all rising interest rate environments are good for financials. Banks tend to borrow on the short-end of the yield curve and lend on the long end. Their margins expand when long-term interest rates rise faster than short-term interest rates. The opposite has been happening in for most of 2018. In fact, the 10-2-year yield spread has been declining since 2014.

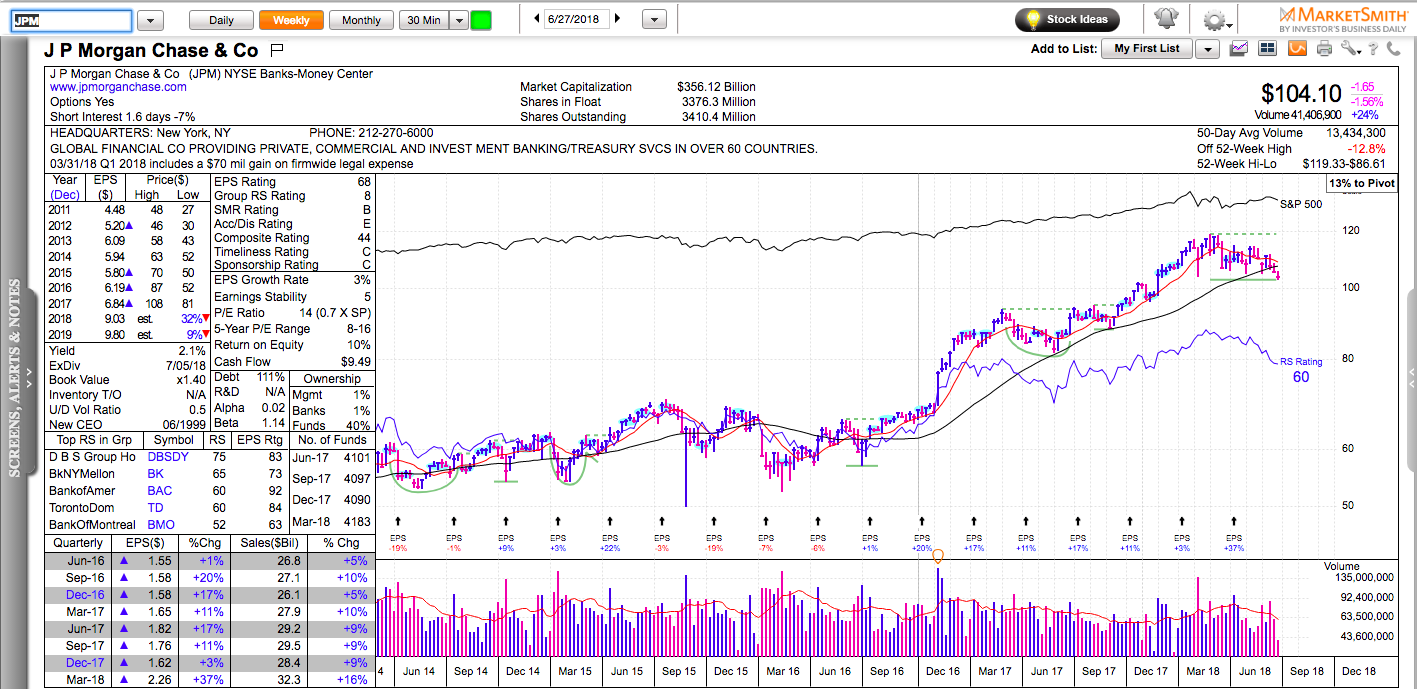
There are many other factors that impact financials’ margins. For example, if you look at JPM’s chart below, you will notice that the decline in the 10-2-year yield spread hasn’t really affected their profitability. JP Morgan’s earnings have increased by 50% since 2014. For the same period, its stock has appreciated 79%, not counting the dividends.

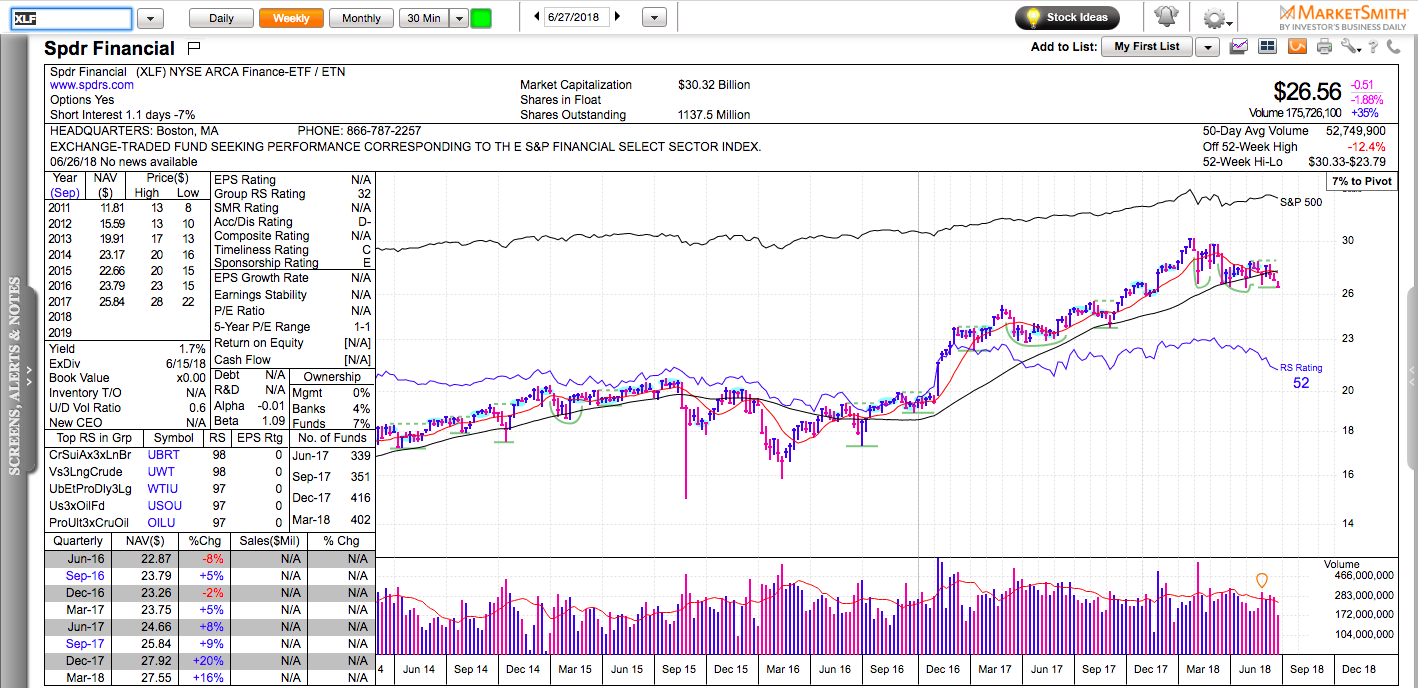
Overall, financials as a group have been showing relative weakness for most of 2018. With a relative strength of 52, the SPdr Financial ETF, XLF is right in the middle of the stack. $24-25 seems like a logical level of potential support. A move above 28.50 would be a bullish development.

Momentum Monday – Stocks Under Pressure

Charts in this post are powered by MarketSmith.

Everyone makes money in a bull market. Not everyone keeps it when the inevitable correction comes. 5% to 10% pullbacks while the major stock market indexes are above their 200-day moving averages are normal and happen at least once a year. A 5% pullback in an index might mean a 20-50% quick decline in most momentum stocks. As hedge fund manager David Tepper likes to remind us “There are times to make money and there are times not to lose money. The key is to wait. Sometimes the hardest thing is to do nothing”.

We cover the following tickers: QQQ, FB, SPY, GOOGL, AAL, GS, ETSY, TWLO, IQ, etc.

Disclaimer: everything on this show is for informational and educational purposes only. The ideas presented are not recommendations to buy or sell stocks. The material presented here might not take into account your specific investment objectives. I may or I may not own some of the securities mentioned. Consult your investment advisor before acting on any of the information provided here.