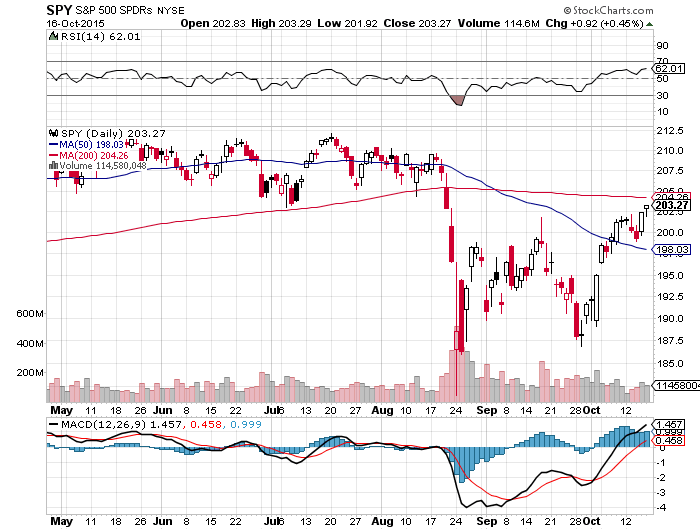
Major U.S. equity indexes are back to clear technical resistance. As a result, tail risk is near all-time highs. People are frantically pointing out to a record levels of put buying in the midst of a rise in the S & P 500. If everyone expects the possibility of a near-term correction and all are hedging against it, what are the odds that it will happen? Usually, very slim. The market rarely does what the majority of people expect.
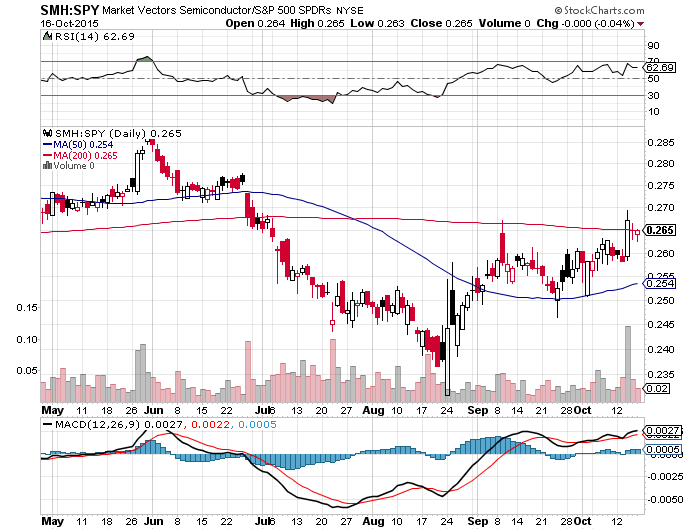
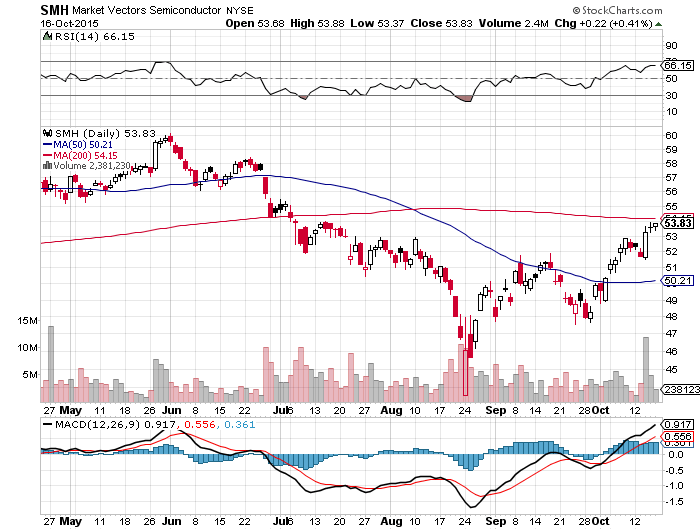
In the mean-time, semiconductors ($SMH) continue to outperform and are back against their declining 200-day moving average. Some say that they are the new Dr. Copper – the real leading indicator in markets. Remember how semis were among the first leading sectors to break down in late June? After that, they kept declining below their 50dma and foreshadowed weakness in the general market several weeks in advance. Now, all of a sudden semis are starting to outperform. Maybe, this time they are foreshadowing a market recovery? They need to clear their 200dma first, of course.
The chart below shows the ratio of Semis to S & P 500 – a great way to spot relative strength or weakness.
For more analysis and stock picks, check my premium subscription.