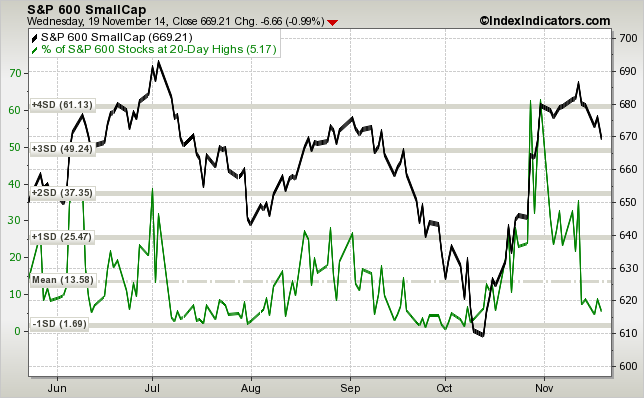
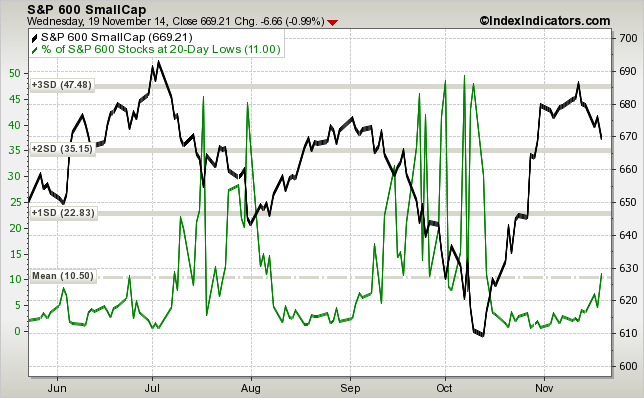
The breadth in small caps continues to deteriorate. Not only are new 20-day lows back below 10%, but new 20-day lows are picking up too, which is an indication of increasing selling pressure:
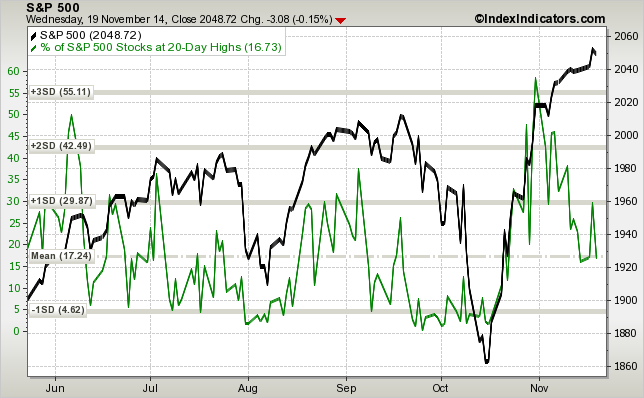
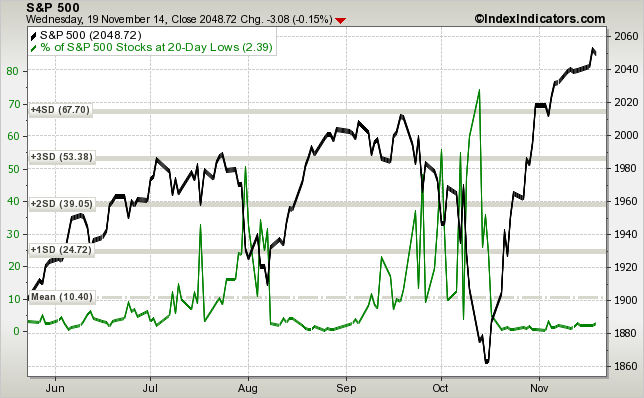
The situation in large caps is different – $SPY has been making new all-time highs on a smaller and smaller number of stocks making new 20-day highs. This is not too unusual after a bounce from a significant pullback. Typically, correlations are very high during the initial stages of a recovery – most stocks bottom together and move higher together. The next stage of a recovery is a market of stocks environment, where stocks start to trade on their individual merits. The big difference in large caps is that the number of new 20-day lows has flatlined. Overall, it means that while people are not too excited about chasing at these levels, they are also reluctant to sell large caps, for now.
One could make the argument that small caps and momentum stocks in general typically lead on the way down and on the way up, but as we have seen over the past couple years – divergencies could continue for quite some time. Bull markets often correct through sector rotation, where leadership changes every few months.
Check my new book: The 5 Secrets To Highly Profitable Swing Trading


